Predictive Accelerated Bench Protocols for Indoor LED Spectral Barcode Grade Decay Trajectories
Accelerated bench protocols isolate multi-channel LED spectral barcode decay vectors to calculate dynamic warranty reserves and secure distribution margins.


Kinetics
Semiconductor emitters utilized in high-precision indoor illumination generate light through electron-hole recombination within indium gallium nitride and aluminum gallium indium phosphide quantum wells. When engineered to produce distinct spectral barcodes, multi-channel LED arrays combine primary narrow-band blue, deep red, far-red, and phosphor-converted green or white emitters. Each optical channel within the fixture operates under distinct thermal stress profiles, carrier densities, and material degradation mechanics.
Evaluating composite system degradation requires isolating the physical rate equations governing each channel, because individual emitter drift alters the radiometric ratio across specified optical bands long before total luminous flux drops below operational thresholds.
Primary InGaN blue die emitters degrade through defect propagation within the active region. Threading dislocations and point defects act as non-radiative recombination centers, incrementally consuming electrical current without releasing photons. At elevated junction temperatures, this lattice defect growth reduces external quantum efficiency.
Simultaneously, the silicone encapsulant housing the semiconductor chip undergoes thermal oxidation and photo-degradation under short-wavelength photon bombardment. Oxidized silicone exhibits localized transmission loss, primarily in the four hundred to four hundred and fifty nanometer range. This selective yellowing alters the spectral profile by attenuating the high-energy blue pump output while allowing longer wavelengths to pass with minimal attenuation.

Semiconductor Degradation and Quantum Efficiency
Active layer defect growth under elevated thermal stress drives non-radiative recombination, reducing photon output across specific spectral emission bands. In aluminum gallium indium phosphide (AlGaInP) red and far-red dies, carrier leakage over the heterojunction barrier increases rapidly with junction temperature due to smaller conduction band offsets relative to InGaN devices. This carrier overflow increases non-radiative recombination rates, causing red channels to degrade at faster rates than blue pump emitters under identical thermal loading.
Auditing spectral power distribution datasets from multi-channel arrays shows that differential degradation rates between InGaN and AlGaInP chips shift the designed radiometric output ratio, corrupting the optical barcode signature relied upon by downstream sensing systems.
The rate of non-radiative defect generation scales exponentially with junction temperature according to modified Arrhenius kinetics. Drive current density amplifies this thermal decay by increasing carrier crowding and localized joule heating within micro-scale lattice regions. The interaction between junction temperature and current density produces a accelerated aging profile that alters spectral balance across operating hours.
High current densities also accelerate electromigration of contact metal into the semiconductor junction, increasing series resistance and localized heating, which further accelerates carrier loss in narrow-band red channels.
A ten-degree rise in junction temperature reduces fluoride phosphor lifetime by forty-two percent under continuous drive conditions.

Phosphor Matrix Quenching and Spectral Drift
Secondary light conversion elements undergo thermal oxidation and mechanical lattice strain when driven at high photon flux densities over extended operating periods. Phosphor materials, such as cerium-doped yttrium aluminum garnet or manganese-doped complex fluorides, convert blue pump photons into broad-spectrum green, yellow, or narrow-red emissions. Thermal quenching lowers the quantum efficiency of these phosphors as operating temperatures rise.
Under continuous thermal stress, structural degradation within the phosphor crystal lattice creates non-radiative pathways, permanently reducing conversion yield.
Complex fluoride phosphors utilized for narrow-band red emission exhibit heightened susceptibility to ambient moisture and heat. Hydrolysis reactions at the phosphor particle boundary break down chemical bond structures, causing severe luminescence decay and centroid wavelength shifts. This localized degradation alters the ratio between direct blue pump radiation and phosphor-converted red output.
The resulting optical barcode drift breaks customer tolerance limits well before total fixture lumen maintenance reaches standard end-of-life parameters.
| Emitter Channel | Dominant Substrate | Activation Energy Range (eV) | Primary Failure Mode | Spectral Barcode Consequence |
|---|---|---|---|---|
| Deep Blue (450 nm) | InGaN on Sapphire | 0.45 – 0.55 | Defect Density Propagation | Pump flux drop and peak wavelength blue-shift |
| Hyper Red (660 nm) | AlGaInP on GaAs | 0.65 – 0.80 | Non-Radiative Center Creation | Red-to-blue power ratio decay exceeding 5% |
| Far Red (730 nm) | AlGaInP on GaAs | 0.70 – 0.85 | Thermal Carrier Leakage | Photoperiod signaling shift beyond target band |
| Narrow Red (630 nm KSF) | Complex Fluoride | 0.85 – 1.05 | Humidity Hydrolysis | Abrupt spectral peak intensity collapse |
Quantifying individual channel kinetics requires isolating thermal activation energy (Ea) and acceleration coefficients for every emitter chemistry inside the array. Arrhenius rate equations model temperature-dependent decay rate constants (k), expressed through the relationship:
k = A · expleft(-fracEakB · Tjright)
Where A represents the pre-exponential frequency factor, kB is the Boltzmann constant, and Tj is the absolute junction temperature in Kelvin. Because activation energies range from 0.45 eV for stable InGaN blue dies up to 1.05 eV for moisture-sensitive fluoride phosphors, elevated thermal testing alters the degradation rate ratio across channels. Standard accelerated models that treat the entire fixture as a single light engine fail to capture differential spectral decay vectors.
Spectral decay vectors track changes in color coordinates (Δ u’v’) alongside radiometric band intensity ratios over time. A shift in radiometric ratios alters the calculated optical barcode, degrading barcode read accuracy in automated agricultural or industrial monitoring setups. Precise bench protocols must decouple thermal stress from photon flux density stress to determine individual rate constants for every channel.
Decoupling these variables involves evaluating arrays across matrixed drive currents and thermal heat-sink boundary conditions. Drive current stress scales non-linearly with current density (J), modifying the rate constant equation to reflect Eyring multi-factor stress models:
k(Tj, J) = A · left(fracTjT0right)n · expleft(-fracEakB · Tjright) · expleft(B · J + fracC · JkB · Tjright)
Empirical constants B, C, and n define the interaction between current density and thermal stress. Generating robust accelerated models requires precise bench measurements across multiple stress states to resolve these parameters without introducing non-physical math artifacts.
Decay dynamics within optical encapsulants present an additional layer of complexity. Silicone formulations undergo heat-induced cross-linking, increasing material stiffness and producing micro-cracks near the phosphor-die interface. These structural micro-voids scatter light, altering the optical path length and increasing internal self-absorption within phosphor layers.
Longer effective path lengths amplify self-absorption, reducing net fixture extraction efficiency in short-wavelength channels and accelerating spectral ratio drift.
Uncontrolled environmental moisture accelerates interfacial delamination between the silicon encapsulant and lead-frame materials. Moisture ingress weakens adhesion bonds, creating refractive index mismatches at optical interfaces. Refractive mismatches increase internal Fresnel reflections, trapping photons within the package and driving localized thermal dissipation upwards.
This thermal feedback loop accelerates defect propagation in narrow-band red emitters, precipitating sudden optical grade decay.
- Phosphor thermal quenching reduces secondary emission efficiency while primary pump flux remains stable, driving a blue-shift in the composite spectral profile.
- Encapsulant darkening caused by thermal oxidation of optical silicone creates progressive attenuation in short-wavelength channels between four hundred and four hundred and fifty nanometers.
- Red emitter lattice degradation in fluoride-based phosphors accelerates under combined elevated thermal and ambient humidity stress, causing sudden far-red ratio drops.
- Die current crowding at high drive densities accelerates defect propagation within the active region, lowering external quantum efficiency at varying rates across distinct semiconductor chips.
Spectral barcode decay tracking demands continuous monitoring of physical emission centroids (λp) and spectral half-widths (Δλ). Centroid wavelength shifts occur as internal electrical fields alter quantum well energy bands under high current densities and elevated junction temperatures. A two-nanometer shift in deep blue pump emission alters phosphor excitation efficiency, changing converted red and green spectral intensity ratios.
Accelerated bench protocols must isolate thermal band-gap narrowing from irreversible physical material degradation.
Lattice strain in pseudo-morphic quantum wells causes piezoelectric fields that shift peak emission wavelengths as current density varies. This Quantum-Confined Stark Effect (QCSE) produces blue-shifts at high current injection, which mask thermal red-shifts caused by band-gap narrowing. Accelerated bench testing protocols must normalize measurements to constant junction temperatures during optical sampling to separate transient QCSE shifts from permanent material decay.
Ambient temperature shifts alter chromaticity in the field, but fundamental phosphor matrix degradation drives long-term spectral ratio shifts.


Bench
Physical testing regimes designed to compress thousands of operating hours into weeks rely on multi-factor stress induction within controlled environmental chambers. Bench protocols for spectral barcode hardware isolate thermal, hygric, and electrical drive stresses while maintaining continuous radiometric data capture. Standard LM-80 test procedures evaluate overall luminous flux maintenance, but fail to deliver the optical sampling resolution needed to predict multi-channel spectral barcode decay trajectories.
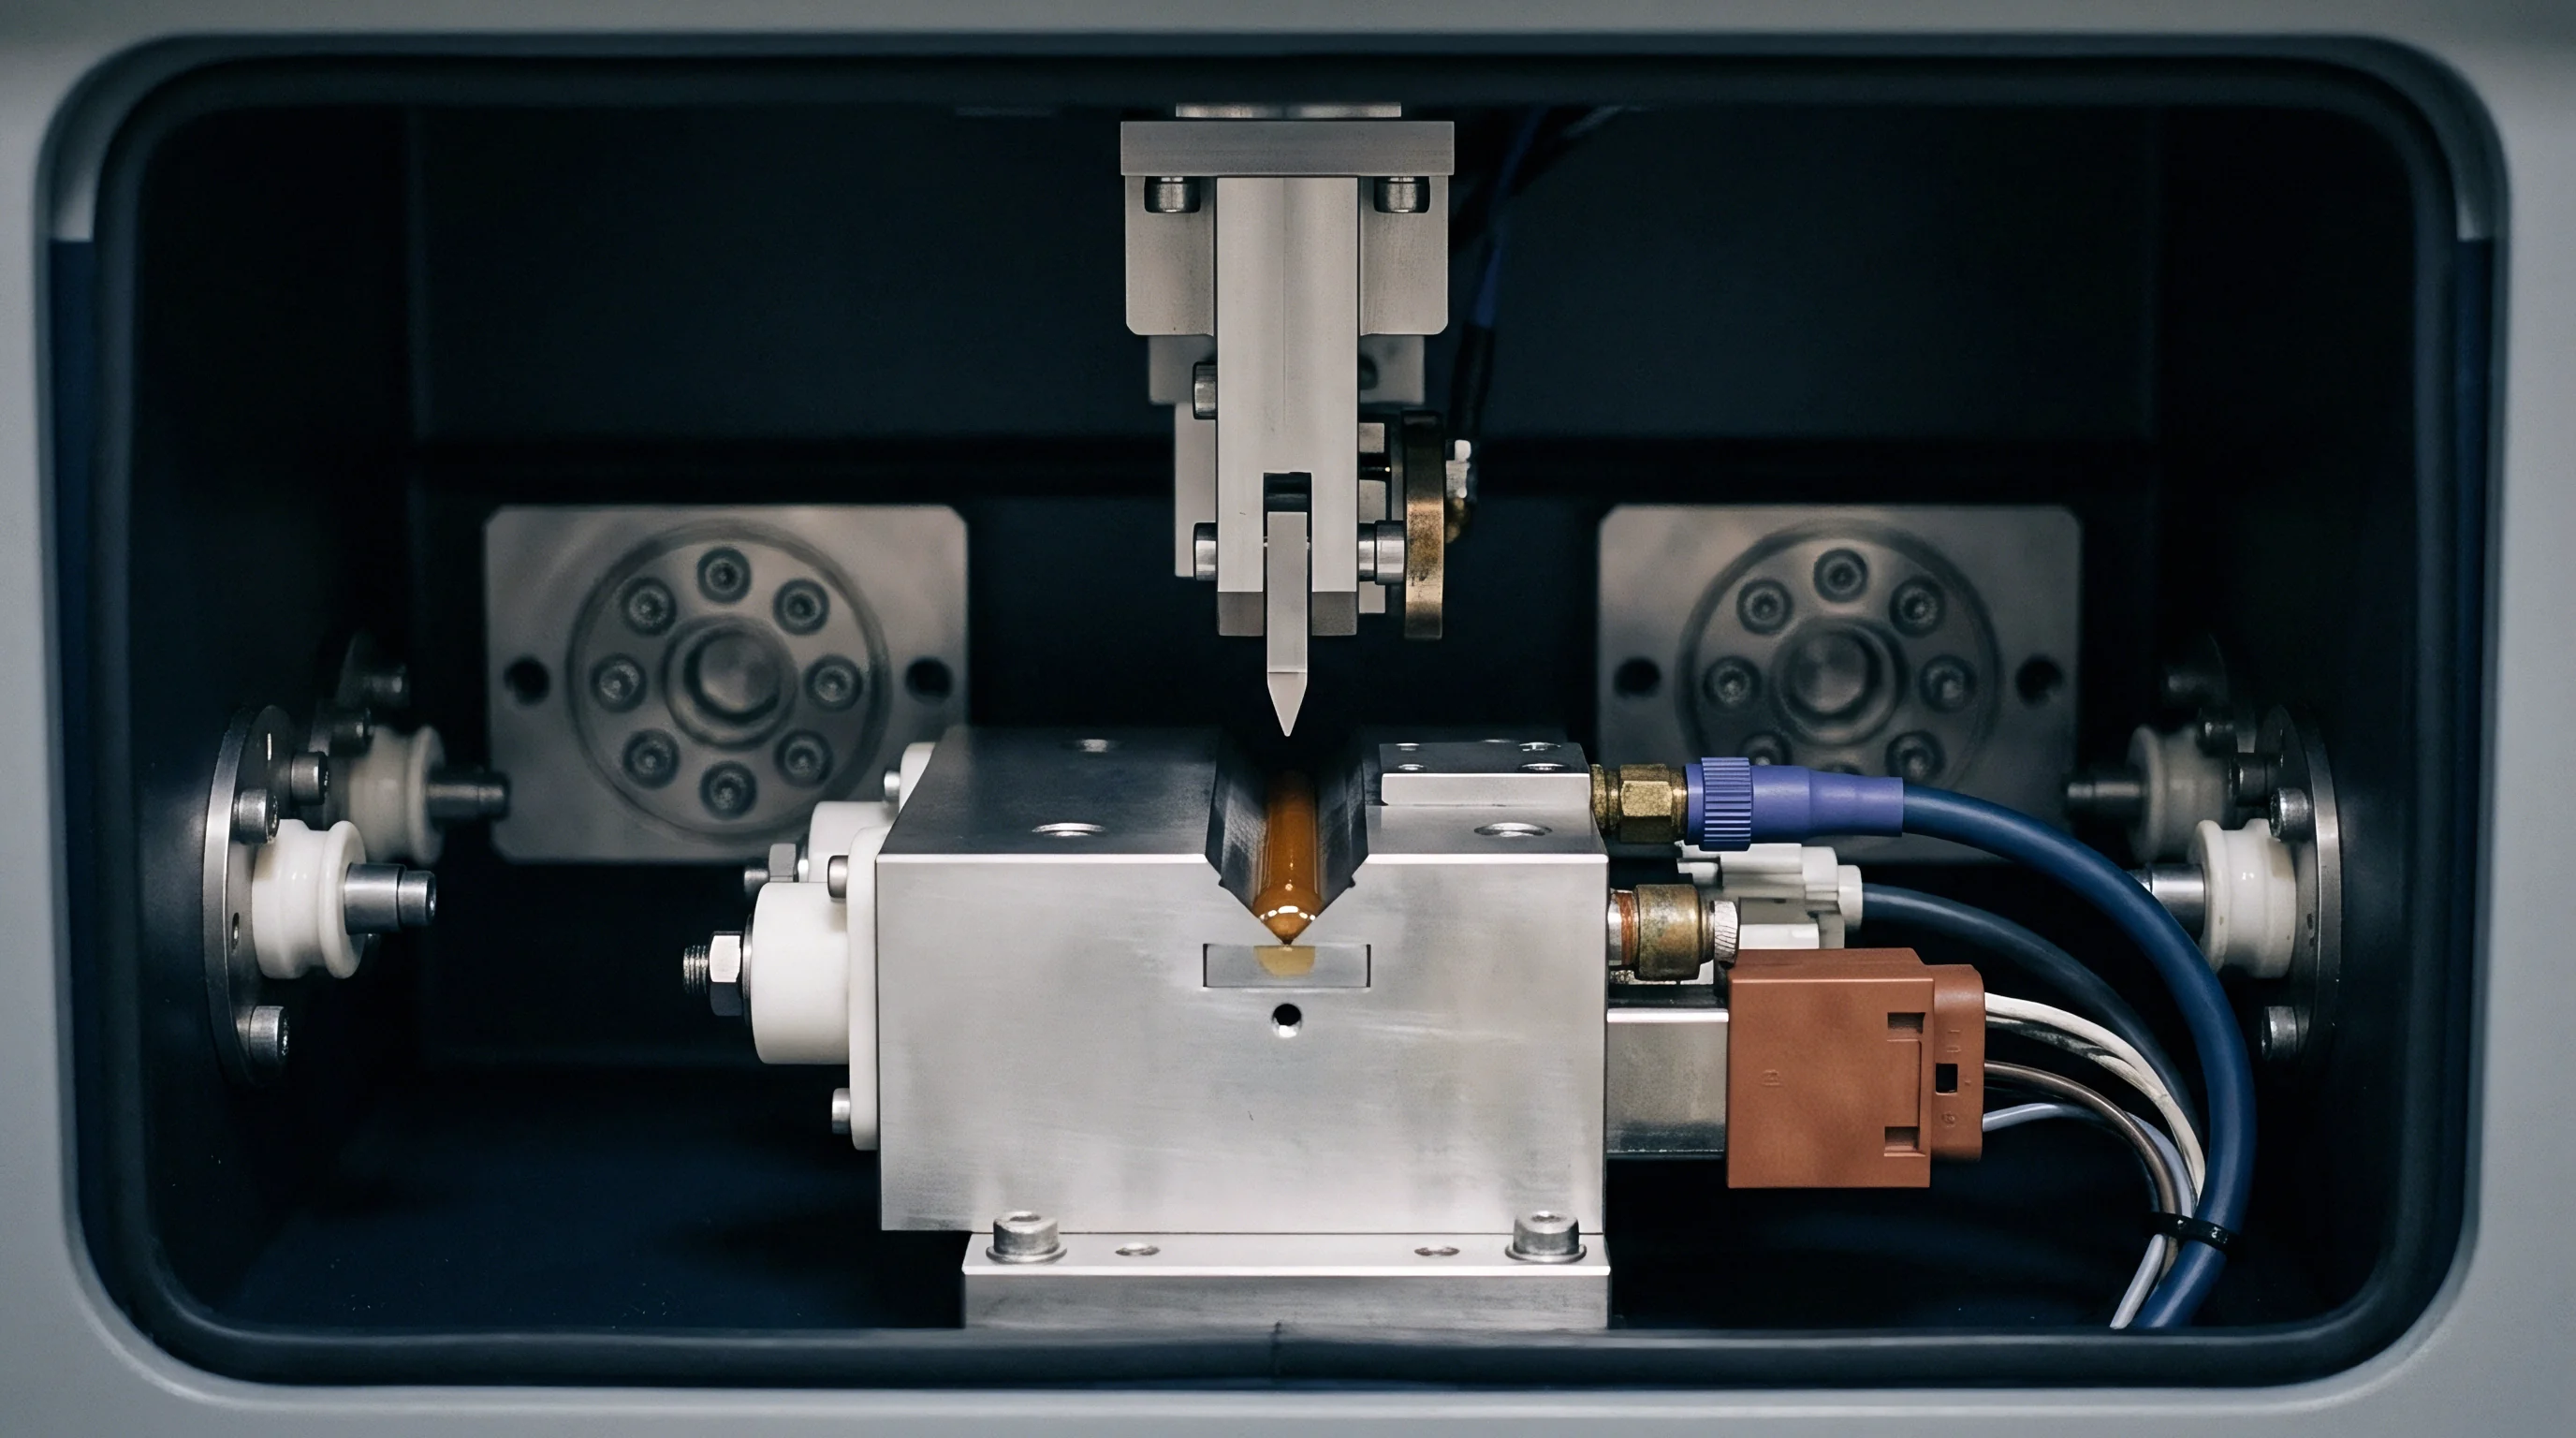
Multi-channel array testing demands individual power channel drive control coupled with automated spectroradiometric integrating sphere measurement system. Bench fixtures mount onto liquid-cooled or Peltier-thermoelectric baseplates capable of controlling solder point temperature (Ts) within a half-degree Celsius window across stress phases. Decoupling heat-sink thermal management from environmental chamber air temperatures allows test operators to stress internal die junctions independently from ambient package humidity levels.

Multi-Factor Environmental Thermal Stressing
Chamber conditions combining eighty-five degrees Celsius ambient air temperature with eighty-five percent relative humidity accelerate moisture ingress into optical silicone encapsulants. Bench protocols apply elevated thermal stress across three distinct test groups held at solder point temperatures of eighty-five, one hundred five, and one hundred twenty-five degrees Celsius. Operating three thermal stress tiers yields data required to compute channel-specific activation energies using non-linear regression techniques.
Solder point temperature regulation prevents localized thermal runaway in high-density narrow-band red arrays.
Continuous drive current pulsing represents an effective stress factor for exposing mechanical bond wire fatigue and interfacial delamination. Step-stress protocols cycle drive current densities from baseline nominal levels up to one hundred fifty percent of peak rated continuous current. Pulse widths and duty cycles are adjusted to induce mechanical thermal expansion cycles at gold or copper wire bonds while suppressing total package junction heating.
High-frequency thermal cycling accelerates shear stress accumulation across die-attach adhesive interfaces.
| Test Protocol | Temperature Stress (°C) | Relative Humidity (%) | Drive Current Density | Sampling Interval (Hours) |
|---|---|---|---|---|
| Standard LM-80 Modified | 85 / 105 | Ambient (<25) | 1.0x Rated | 250 |
| High-Temp Drive Pulse | 105 / 125 | Ambient (<25) | 1.5x Peak Pulse | 100 |
| Coupled Thermo-Hygric | 85 | 85 | 1.0x Rated | 168 |
| Multi-Factor Stress Stepping | 85 to 135 Step | 50 to 85 Step | 1.2x to 1.8x Step | 48 |
Continuous spectroradiometric data acquisition requires optical fiber probes routed directly through environmental chamber walls into multi-channel spectroradiometers. Integrating spheres positioned outside the thermal chamber maintain stable detector temperature states, eliminating thermal detector drift artifacts. Measurement procedures capture absolute spectral irradiance across three hundred eighty to eight hundred fifty nanometer ranges at five-nanometer optical resolution.

Spectroradiometric Integration and Sampling Cadence
Continuous measurement cycles capture flux variations across five-nanometer wavelength intervals to track ratio shifts between blue pump sources and secondary emitters. Radiometric sampling intervals must occur every forty-eight hours during initial five hundred operating hours, when rapid initial degradation (short-term burn-in drop) occurs. Sampling intervals can extend to two hundred fifty hours once degradation slope vectors stabilize into steady-state linear or exponential decay phases.
Failure to maintain junction thermal control within two degrees during spectroradiometric sampling invalidates accelerated decay projections under IES TM-21 guidelines.
Evaluating multi-channel array decay involves tracking five primary spectral barcode metrics: narrow-band blue peak height (Pb), narrow-band red peak height (Pr), far-red peak height (Pfr), broad-spectrum green-to-yellow converted flux integral (Ig), and blue-to-red radiometric power ratio (Rbr). Spectral barcode tolerance windows define absolute operational bounds for each parameter. When any metric strays past set percentage limits relative to baseline values, the array breaches barcode compliance standards.
Baseline calibration requires burning in test units for one hundred hours at nominal current and twenty-five degrees Celsius ambient conditions. Early burn-in removes transient structural defects and stabilizes initial phosphor conversion efficiencies. Bench test protocols record baseline absolute spectral power distributions (SPD0(λ)) following burn-in, establishing reference profiles against which all subsequent accelerated degradation measurements are compared.
Automated bench software calculates normalized spectral shift vectors (vecS(t)) at each measurement interval using the equation:
vecS(t) = intλ1λ2 left| fracSPD(t, λ)Itotal(t) – fracSPD0(λ)Itotal, 0 right| dλ
Calculating the normalized absolute difference across wavelength bands isolates pure spectral shape shifts from overall lumen depreciation. An array maintaining ninety percent of total lumen output can exhibit severe spectral shift if short-wavelength output decays while long-wavelength output remains flat. High-precision spectral barcode tracking relies on identifying shape-vector shifts early in accelerated test schedules.
- Mount test arrays on thermal control blocks maintaining active junction temperature stabilization within one-half degree Celsius.
- Apply step-stress drive currents incrementally from baseline operating levels to maximum rated peak density over twenty-four hour intervals.
- Expose assemblies to combined thermal and relative humidity cycles inside sealed environmental chambers for minimum five hundred hour blocks.
- Transfer fixtures into an integrating sphere system to capture high-resolution spectral power distribution data at predetermined thermal equilibrium states.
- Compute spectral barcode drift vectors by evaluating changes across designated wavelength bands relative to baseline calibration profiles.
Bench systems utilize closed-loop liquid chillers connected to cold plates to manage micro-channel heat dissipation. Cold plates fitted with micro-machined internal copper fins reduce thermal resistance between LED board substrates and circulating coolant fluid down to values below 0.15 °C/W. Minimizing thermal resistance prevents junction temperature overshoots when current density step pulses are applied during accelerated stress testing.
In-situ electrical impedance spectroscopy (EIS) integrated into test benches provides real-time diagnostic insight into semiconductor junction degradation without removing fixtures from chambers. By applying high-frequency AC ripple currents over DC drive bias, EIS measures changes in junction capacitance and series resistance. Increasing series resistance signals bond wire micro-cracking or contact degradation, while capacitance shifts correlate directly with active region defect creation.
EIS diagnostics track physical structural failure initiation hours before optical spectroradiometer instruments register external output drops.
Calibration regimens for external spectroradiometers require strict adherence to traceable halogen and deuterium reference standard lamps. Lamp calibration drift must remain below 0.5% across the target spectral range over one hundred operating hours. Recalibrating optical detectors every two hundred fifty hours prevents instrument sensitivity drift from masking or exaggerating light engine spectral decay trends.
Advanced bench protocols integrate high-speed spatial light measurements to detect non-uniform degradation across physical array surface areas. Automated mechanical stages scan spatial intensity distributions across multi-die arrays, capturing optical beam profile distortions caused by localized phosphor discoloration or individual die failure. Spatial spectral variations skew directional optical barcode readings, compromising performance in narrow-beam optical systems.
Environmental stress testing must incorporate atmospheric contaminant gas exposure to simulate harsh real-world installations. Trace amounts of hydrogen sulfide or sulfur dioxide gas introduced into humidity-controlled chambers accelerate lead-frame silver plating tarnishing. Tarnished silver lead-frames lose internal optical reflectivity, reducing photon extraction efficiency and altering output spectral balances.
Quantifying tarnish rates under controlled sulfur gas concentration establishes environmental resistance limits for commercial arrays.
Miscalculating acceleration factors leads to underfunded warranty reserves and unexpected inventory write-downs when delivered arrays shift past client specification boundaries in commercial deployments.


Projections
Mathematical models converting short-term laboratory stress measurements into multi-year operational decay vectors isolate individual emitter channels before synthesizing composite performance profiles. Conventional lumen maintenance standards, such as IES TM-21, use single-exponential curve fitting on total luminous flux datasets. Applying single-exponential models to multi-channel optical barcode hardware yields erroneous projections because individual emitter chemistries follow distinct decay curves governed by different physical activation energies.
Projections for optical barcode retention require multi-exponential or non-linear multi-factor regression models. Each emission band (i) is assigned an independent decay function (Fi(t)) parameterized by channel junction temperature (Tj,i) and channel current density (Ji):
Fi(t) = αi · exp(-βi(Tj,i, Ji) · tγi)
The parameter αi represents initial projection scaling, βi defines the accelerated decay rate coefficient, and γi models non-linear stretched-exponential behavior caused by progressive defect accumulation. Setting γi = 1 forces standard exponential behavior, whereas values of γi ≠ 1 accurately model complex degradation mechanisms, such as phosphor hydrolysis or moisture-driven encapsulant darkening.

What Triggers Accelerated Spectral Grade Reclassification?
Boundary breaches occur when differential channel degradation forces the radiometric output ratio beyond defined customer specification windows. Spectral grade tiers categorize arrays by optical precision: Grade A fixtures maintain individual channel ratios within a strict two percent deviation window; Grade B fixtures allow up to five percent deviation; Grade C fixtures permit up to ten percent deviation. Reclassification occurs the moment projected channel ratio decay vectors cross these boundary limits.
Gaussian process regression maps confidence intervals around predicted grade transition timeframes. Non-parametric Bayesian regression incorporates bench test measurement noise and sample-to-sample manufacturing variance directly into trajectory distributions. Gaussian process models deliver probabilistic predictions, establishing time-to-failure windows at specific confidence bounds (such as 95% upper and lower prediction intervals) rather than returning single deterministic lifespan values.
Combining Arrhenius temperature acceleration factors with Eyring current density parameters yields acceleration factor equations (AFi) for each optical channel:
AFi = left(fracJtest, iJuse, iright)m · expleft
Projecting operational lifespan at nominal conditions involves multiplying bench stress duration (ttest) by the channel-specific acceleration factor (AFi). Because narrow-band red channels exhibit higher activation energies (Ea ≈ 0.80 eV) than blue channels (Ea ≈ 0.50 eV), elevating test temperatures over-accelerates red channel decay relative to blue channel decay. Life-projection algorithms must re-normalize raw bench data to remove operational spectral distortion caused by differential thermal acceleration.
Single-channel spectral shift always precedes total luminous flux degradation in multi-die LED architectures.

Mathematical Algorithms for Multi-Channel Extrapolation
Curve fitting methods using non-linear least squares estimate decay constants for each independent color channel within a multi-die architecture. Channel equations synthesize composite spectral power distributions across operational time frames, calculating expected color coordinates (u'(t), v'(t)), centroid wavelength shifts (Δλp(t)), and narrow-band radiometric output ratios (Rbr(t)). Grade reclassification intervals are established by identifying time points where extrapolated metric curves intersect defined customer tolerance thresholds.
Stochastic Monte Carlo simulations propagate parameter uncertainties through degradation models, generating failure distribution curves over extended operating hours. Randomly sampling activation energies, pre-exponential factors, and initial burn-in variances from input distribution functions allows Monte Carlo modeling to yield Weibull hazard rate distributions. Weibull shape parameters (kw) and scale parameters (ηw) quantify array reliability trends, distinguishing early wear-out modes from random field failure risks.
Determining cumulative degradation under dynamic operating conditions demands transient thermal-electrical modeling coupled with kinetics equations. Indoor agricultural and technical arrays frequently run dynamic light recipes, altering channel drive currents throughout operational cycles. Dynamic operating regimes shift junction temperatures continuously, preventing static life-projection algorithms from capturing transient thermal stress spikes.
Miner’s cumulative damage hypothesis provides a framework for integrating transient stress damage over time. Total damage (D) accumulates linearly across varying operating states according to the sum of fractional lifespans consumed:
D = sumk=1N fractkLk(Tj,k, Jk)
Where tk represents operating duration at state k, and Lk represents predicted lifespan under state k conditions derived from accelerated bench test equations. Grade reclassification occurs when cumulative damage D reaches unity, signaling that spectral ratio drift has permanently breached product specification boundaries.
Non-linear damage accumulation physics requires adjusting simple linear Miner’s models when high-stress phases accelerate defect creation mechanisms. Structural lattice defects formed during brief elevated drive pulses act as permanent recombination centers that accelerate low-current decay rates. Advanced predictive software incorporates sequential stress memory terms to prevent underestimating optical grade decay under dynamic lighting schedules.
Machine learning models trained on high-density bench test datasets enhance long-term projection accuracy. Deep neural networks optimized on spectral power time-series data detect subtle non-linear spectral distribution shifts long before conventional curve-fitting algorithms register drift. Coupling physical semiconductor degradation rate equations with machine learning pattern recognition improves predictive confidence in long-range grade decay trajectories.
How long non-linear phosphor degradation modes remain latent under low-duty cycle operations remains an open question that current mathematical models cannot reliably answer.


Reserves
Financial balances set aside to cover product performance failures reflect the commercial reality of optical band degradation in high-value technical lighting deployments. When indoor agricultural facilities or optical sensing setups procure multi-channel lighting arrays, supply agreements mandate strict spectral barcode performance guarantees. If delivered fixtures exhibit spectral drift that alters plant morphology or disrupts automated optical barcode detection systems, end-users file performance claims.
Distributors and manufacturers must maintain financial return reserves to cover potential warranty claims, product re-classifications, and channel clawbacks.
Quantifying financial reserve requirements requires linking physical decay models directly to contract liability formulas. Traditional reserve models allocate fixed percentage caps (such as 2% of gross invoice value) to cover general batch returns. This static strategy exposes suppliers to balance sheet risks when dealing with complex multi-channel hardware.
If accelerated bench testing indicates a seven percent probability that narrow-band red channels will drift past tolerance limits within eighteen operating months, reserve allocations must scale dynamically to absorb anticipated warranty field retrofits.

Channel Margin Stacks and Deduction Mechanics
Tiered distribution structures absorb financial risk by altering net payout figures based on post-sale field performance metrics. Standard route-to-market channels involve component suppliers, original equipment manufacturers (OEMs), regional master distributors, value-added resellers (VARs), and end-use commercial integrators. Each tier extracts a gross margin slice reflecting its operational inventory risk, customer acquisition cost, and technical support burden.
Distributor agreements contain deduction clauses permitting channel partners to penalize suppliers for delivered batches that fail secondary optical audits. Deductions surface on remittance advices as line-item withholdings against future inventory shipments. Unresolved spectral decay issues trigger inventory holdbacks, where distributors lock warehouse stock and defer invoice payments until factory engineering teams re-certify optical grade compliance.
| Distribution Tier | Gross Tier Margin (%) | Standard Return Reserve (%) | Spectral Failure Penalty (%) | Net Realized Margin (%) |
|---|---|---|---|---|
| Direct Commercial Integrator | 18.0 | 2.0 | 4.5 | 11.5 |
| Master Regional Distributor | 28.0 | 3.5 | 6.0 | 18.5 |
| Value-Added Reseller | 35.0 | 5.0 | 8.5 | 21.5 |
Supply agreements structure standard lumen loss separately from spectral barcode drift. Standard lumen maintenance clauses address broad fixture light output drops, whereas optical barcode clauses govern radiometric ratio retention within tight wavelength bands. Establishing separate contractual definitions prevents buyers from returning functional, high-output fixtures over minor spectral shifts, while protecting integrators when targeted band decay breaches technical specification limits.

Contractual Allocation of Grade Decay Exposure
Supply contracts for technical optical arrays establish specific performance thresholds that determine which party funds replacement stock during warranty periods. Agreement terms assign primary exposure to component packaging suppliers if accelerated bench audits confirm root-cause phosphor hydrolysis or die-level defect propagation. If spectral decay stems from unapproved luminaire driver substitutions or thermal heat-sink modifications made by OEMs, liability transfers to the fixture assembler.
Commercial contracts incorporate performance SLA penalty ladders tied to spectral grade transitions. If an array delivered as Grade A drifts into Grade B parameters within twenty-four operating months, the supplier reimburses the price differential between grade tiers via direct credit memos. If drift crosses into Grade C parameters, the contract obligates the supplier to deliver full unit replacements and cover onsite field labor removal and re-installation costs.
Distributors demand higher margin retention on multi-channel arrays lacking independent accelerated spectral test dossiers.
Managing inventory valuation risks requires continuous batch re-grading programs. When warehouse stock sits for extended periods before channel distribution, physical degradation can occur due to environmental storage conditions. Distributors execute accelerated bench audits on pulled lot samples prior to customer release.
Batches showing early spectral shift are re-classified into secondary application tiers, forcing immediate balance sheet write-downs equal to the realized price delta between primary and secondary market channels.
Master distribution agreements include inventory buyback provisions triggered by recurring spectral batch failures. If two consecutive production lots demonstrate accelerated spectral decay exceeding five percent during incoming quarantine testing, master distributors retain contractual rights to cancel outstanding purchase orders and return all unsold inventory for full cash refunds. Exercising buyback clauses causes immediate cash flow pressure, requiring suppliers to preserve liquid capital reserves during product launches.
- Spectral threshold boundaries must be defined using narrow radiometric ratio tolerances rather than broad chromaticity shift ellipses.
- Batch sampling rights give distributors authority to pull warehouse stock for bench testing prior to retail channel release.
- Clawback deduction caps prevent channel partners from penalizing inventory beyond the net invoice value of affected production lots.
- Return reserve schedules require quarterly adjustments based on updated accelerated bench decay data rather than flat historic averages.
Escrow provisions in high-value commercial supply contracts mandate establishing separate cash reserves held by third-party financial institutions. Escrow funds unlock incrementally over time as delivered production lots reach designated operational milestones without registering field spectral failure claims. Secure escrow arrangements give commercial buyers confidence while providing clear financial targets for manufacturing performance teams.
Channel insurance products covering technical product performance liabilities require comprehensive accelerated bench testing dossiers before issuing coverage policies. Underwriters audit thermal junction stress protocols, spectroradiometric sampling procedures, and activation energy calculations. Incomplete bench data results in elevated policy premiums or explicit coverage exclusions for multi-channel spectral ratio failures.
Section 8.4 of the standard channel distribution agreement shifts financial liability for spectral reclassification directly to the manufacturer once batch decay vectors exceed three percent per thousand operating hours.


Yield
Commercial realization on engineered illumination hardware depends on matching factory binning classifications to channel price tiers throughout the physical service life of the stock. Maximizing net capital realization demands active management of production yield distributions, optical grade classifications, and secondary channel sales paths. Factory production produces a natural bell-curve distribution of spectral barcode tolerances.
Sorting arrays into narrow performance grades allows manufacturers to extract premium margins from top-tier technical buyers while selling lower-grade output into broader illumination markets.
Evaluating net channel yield requires tracking the margin stack from factory door to end installation, accounting for every chargeback, return allowance, and tier discount along the distribution path. High gross margins printed on paper frequently evaporate after factoring in real-world channel costs, return reserves, and grade-decay credit adjustments. A product line delivering a forty percent gross manufacturing margin can drop to a sub-ten percent net realized yield if batch spectral decay triggers channel deductions across master distribution tiers.
Inventory Downgrading and Secondary Channel Payouts
Production lots failing primary spectral barcode standards transition into secondary agricultural or general illumination markets at discounted unit values. Secondary markets absorb lower-grade optical hardware, but force suppliers to accept reduced price points. A multi-channel array engineered for automated optical sensing that yields a two hundred dollar unit price as a Grade A product drops to eighty dollars when re-classified as Grade C broad-spectrum supplemental lighting.
Secondary channel sales recover initial component material costs, but fail to cover allocated research and development overhead.
Secondary channel distribution agreements must restrict re-classified stock from re-entering primary technical markets. Gray-market cross-shoppers can acquire discounted Grade C inventory and resell it into high-precision application channels, undercutting primary sales networks and damaging brand credibility. Technical supply contracts mandate applying physical laser-etched markings and modified SKU packaging to secondary inventory, preventing gray-market cross-channel diversion.

Settlement Formulas and Net Capital Realization
Final financial reconciliation between manufacturers and distributors computes net case payouts after deducting return provisions and field adjustment credits. Net realized capital per shipped unit (Cnet) follows the structural cash realization formula:
Cnet = Pbase · (1 – Dtier) – Creserve – Cclawback – Cwarranty · P(Decay > Threshold)
Where Pbase represents nominal list price, Dtier is tier discount percentage, Creserve is mandatory return reserve holdback, Cclawback accounts for administrative chargebacks, and Cwarranty represents average unit replacement cost weighted by the cumulative probability (P) of spectral decay exceeding tolerance limits within warranty periods.
Walked forward through an operational example, an array listing at three hundred dollars with a thirty percent distributor tier discount (Dtier = 0.30) yields a gross channel price of two hundred ten dollars. Subtracting a five percent return reserve (Creserve = $10.50), two percent chargeback allowance (Cclawback = $4.20), and a weighted warranty liability exposure (Cwarranty · P = $18.30) reduces net realized capital to one hundred seventy-seven dollars and dollars and hundredths per unit. If accelerated bench testing reveals higher spectral decay probabilities, warranty liability terms expand, eroding net capital realization further.
Optimizing inventory working capital demands matching production yield curves to channel demand profiles. When manufacturing lines produce excess Grade B or C inventory relative to market demand, holding low-grade stock consumes warehouse space and ties up operational working capital. Dynamic channel pricing algorithms adjust tier discounts in real time based on factory binning yields, accelerating inventory liquidation and preserving cash flow velocity.
Working capital management also requires balancing production batch sizes against optical grade shelf-life decay risks. Storing assembled multi-channel arrays in unconditioned warehouse environments accelerates package oxidation and moisture ingress prior to sale. Implementing lean build-to-order manufacturing workflows minimizes holding durations for finished goods, ensuring delivered arrays enter active field service with pristine optical barcode specifications.
Commercial success in high-precision LED hardware relies on integrating physical accelerated testing data directly into financial contract models. Technical engineering teams and financial controllers must collaborate to audit degradation rate constants, refine predictive decay algorithms, and set accurate channel warranty reserves. Aligning physical degradation physics with commercial channel agreement terms protects profit margins, secures distribution networks, and ensures long-term business viability.
Realized channel profit depends more on contractual return protection clauses than on factory production efficiency.