Aerodynamic Wind Tunnel Calibration Standards for High Speed Skins
Aerodynamic skin calibration requires verifying transducer step height under 5 micrometers and freestream noise below 0.05 percent before flight data release.
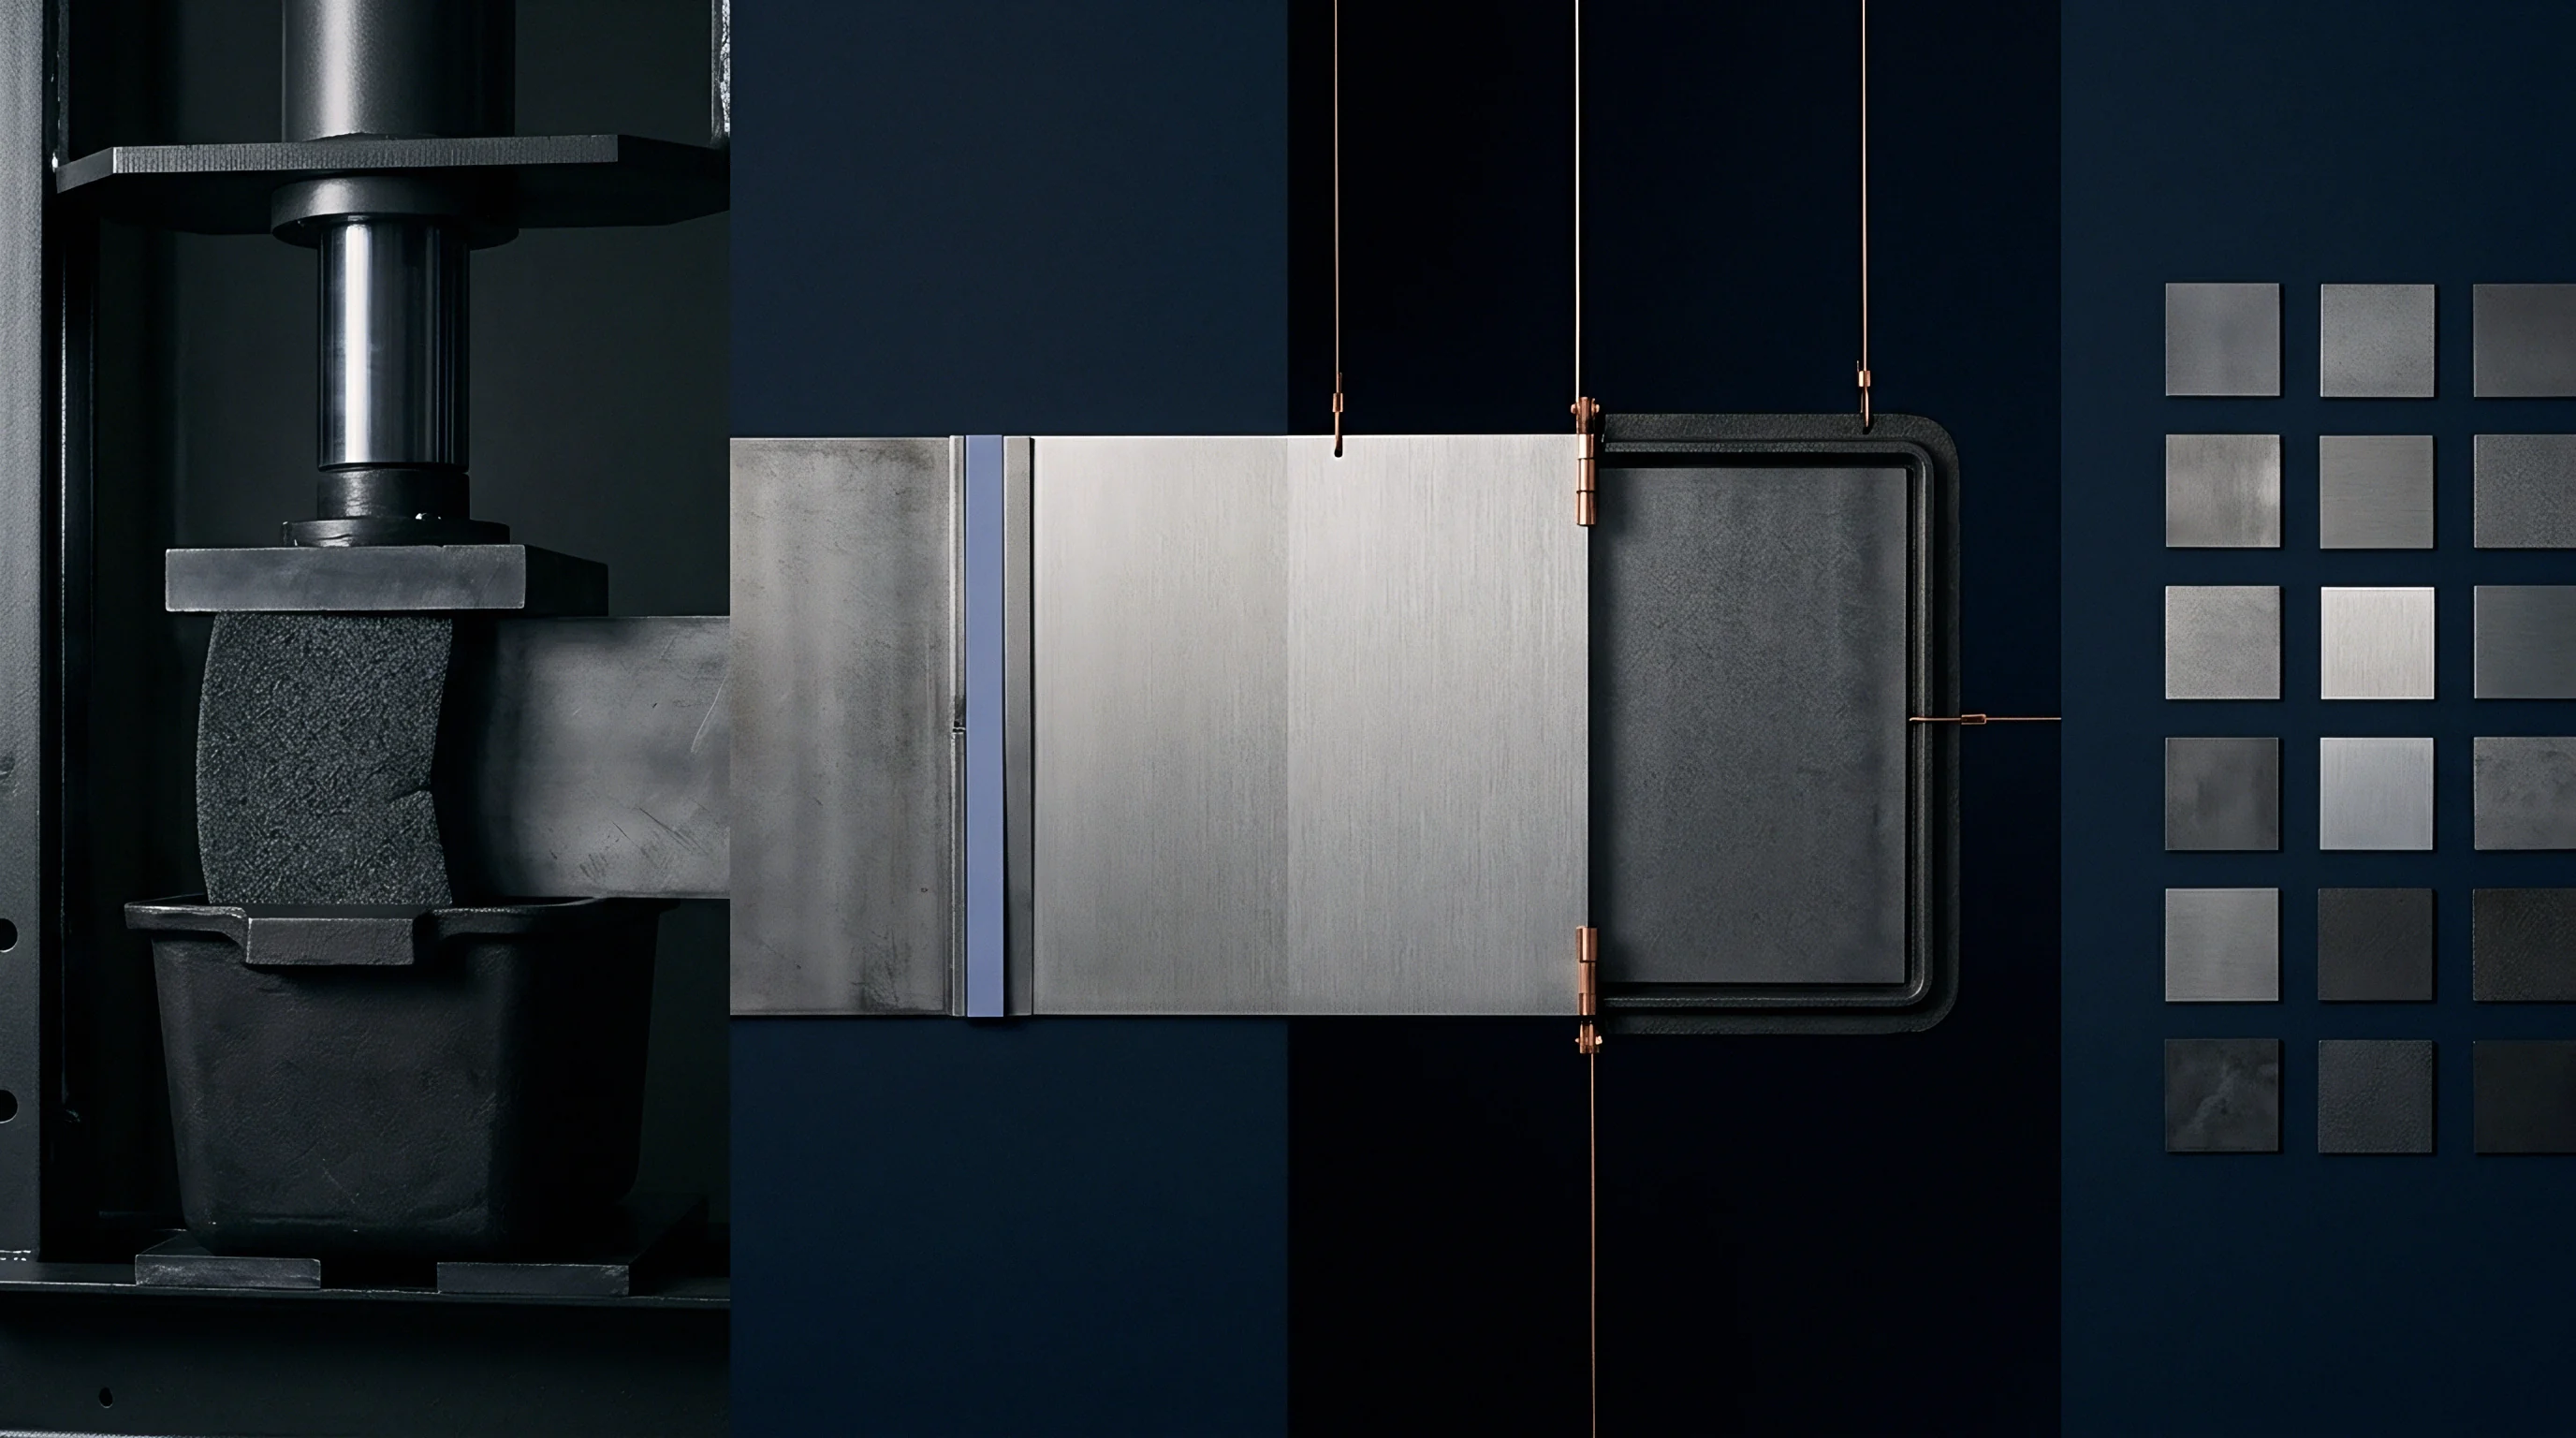

Heat
Stagnation enthalpy measurements in high-speed ground test facilities determine the energy transferred into vehicle flight structures. In supersonic and hypersonic regimes, aerodynamic heating dominates structural boundary design, requiring precise thermal transducer calibration before any wind tunnel campaign begins. Aerothermal balance governs skin design.
Ground test facilities simulating Mach 3 to Mach 10 environments generate high thermal gradients across skin test panels, forcing calibration routines to account for transient wall conduction, transducer thermal mass, and radiation losses.
Enthalpy Matching in High Enthalpy Wind Tunnels
Total enthalpy calibration requires matching freestream velocity and temperature profiles within blowdown and arc-jet facilities. Heat flux sensors embedded inside skin panels experience rapid thermal transients during nozzle start-up. Standard calibration methodologies utilize high-intensity infrared radiant heating lamps or laser absorption systems to establish sensor response curves prior to installation in the tunnel test section.
Fast response time prevents thermal saturation.
Coaxial thermocouples and thin-film resistance thermometers provide sub-millisecond response times necessary for short-duration shock tunnels. The calibration of coaxial thermocouples depends on the accurate knowledge of the thermal product of the substrate material, defined as the square root of the product of thermal conductivity, density, and specific heat capacity. Calibrated radiant flux sources expose the sensor face to known heat rates ranging from 0.5 to 50 megawatts per square meter, establishing the voltage-to-heat flux conversion factor under controlled room-temperature conditions.
A 5 percent variation in freestream total enthalpy alters boundary layer recovery temperature calculations by up to 42 Kelvin at Mach 6.
Thermal gradients alter gage sensitivity factors. When skin panels experience rapid surface heating, lateral heat conduction from the sensor body into the surrounding metal structure distorts one-dimensional heat transfer assumptions. Numerical correction models use measured transient wall temperatures to adjust raw heat flux readings during post-test processing.

Coaxial Thermocouple Response and Surface Temperature Corrections
Dynamic temperature calibration relies on fast-response heat sources that deliver known energy steps. Coaxial thermocouples utilize a micro-thin junction formed at the polished sensing face by mechanical abrading. This junction layer, often under 2 micrometers in thickness, yields response times under 1 microsecond.
Calibration routines verify that thermal diffusion across the junction material remains uniform to prevent localized thermal resistance errors.
Raw voltage signals demand temperature compensation. Signal drift caused by thermal softening of junction materials or thermoelectric property shifts at elevated temperatures degrades measurement accuracy. Reference thermal wells housing NIST-traceable thermocouple standards establish baseline calibration curves across the expected operational range from 200 Kelvin to 1800 Kelvin.
| Transducer Type | Operating Temperature Range (K) | Response Time | Heat Flux Limit (MW/m²) | Calibration Uncertainty (%) |
|---|---|---|---|---|
| Coaxial Thermocouple | 100 to 1800 | 1 microsecond | 100 | ±3.5 |
| Thin-Film Resistance Gage | 150 to 600 | 10 nanoseconds | 20 | ±2.1 |
| Gardon Gauge (Schmidt-Boelter) | 290 to 1200 | 50 milliseconds | 10 | ±2.8 |
| Heat Flux Microsensor | 200 to 1100 | 1 microsecond | 50 | ±4.0 |
| Data normalized across steady-state arc-jet and transient shock tube calibration runs. | ||||
Incorrect thermal calibrations lead directly to structural over-design or unpredicted thermal barrier coating degradation during atmospheric re-entry.


Shear
Wall friction measurements dictate the skin drag component of high-speed aerospace vehicles. Accurate calibration of skin friction sensors inside wind tunnels requires resolving microscopic force vectors in high-dynamic-pressure environments. Boundary layer velocity gradients at high Mach numbers generate intense wall shear stresses, making precise alignment and surface flushness critical to transducer performance.
Direct versus Indirect Wall Friction Measurements
Floating element balances directly measure the tangentially aligned mechanical force exerted by airflow over a decoupled plate surface. Calibration of floating element balances involves applying micro-gram mass loads via precision pulley systems or piezoelectric actuators while the balance resides in a vacuum-sealed calibration housing. Flexure restoring forces are measured with inductive displacement transducers, establishing linear voltage-to-force scales.
Oil film interferometry provides an indirect visual method for establishing wall shear stress without surface gaps. Silicon oil of known kinematic viscosity is applied to the skin surface prior to tunnel execution. Monochromatic light beams illuminate the thinning oil blob during airflow exposure, creating interference fringes whose drift velocity scales directly with wall friction.
Viscosity sensitivity to temperature dictates simultaneous thermal mapping of the skin panel using temperature-sensitive paint or embedded thermocouples.
Sensor recess depth distorts local shear. Micro-Electro-Mechanical Systems (MEMS) skin friction sensors offer high spatial resolution but suffer from cross-axis sensitivity to normal pressure gradients. Calibration protocols isolate shear sensitivity from pressure fluctuations by testing sensors inside sealed static pressure chambers before running wind tunnel trials.

Where Do Boundary Layer Transition Pitfalls Disrupt Skin Friction Measurements?
Laminar-to-turbulent boundary layer transition causes a dramatic jump in wall shear stress, often increasing local skin drag by a factor of three to five. When skin friction sensors sit within the transition zone, unsteady turbulent spot passage creates severe signal fluctuations that obscure mean shear values.
- Thermal drift overshooting compensation circuits occurs when rapid enthalpy spikes create localized temperature gradients across the silicon substrate prior to heat sink equilibration.
- Combustion residue deposition on floating elements alters mechanical gap clearances, locking the flexure beam and underreporting skin friction by over 30 percent.
- Pneumatic cavity resonance inside sensor housings introduces false high-frequency acoustic oscillations into dynamic pressure spectra during blowdown transients.
- Substrate thermal expansion misalignment forces sensor edges above the local skin surface, triggering localized boundary layer trips.
Sensor manufacturers frequently defend offset drifts by claiming test section flow quality varied beyond nominal calibration parameters during the blowdown cycle.

Probe
Surface-mounted sensor recess depths and pressure tap orifice geometry dictate boundary layer flow distortion during supersonic testing. Pressure transducers integrated into vehicle skins require pneumatic and dynamic response calibrations to eliminate measurement lag and spatial pressure distortion. Uncalibrated steps create localized shock waves.

Flush Sensor Alignment and Recess Step Tolerances
Protrusion or recess of sensors relative to the surrounding skin panel modifies local flow field structures. Forward-facing steps generate localized shock waves that artificially elevate surface pressure and heat transfer rates. Rearward-facing steps induce localized boundary layer separation, lowering local static pressure readings while increasing acoustic disturbance levels downstream.
Laser optical profilometry verifies sensor flushness prior to wind tunnel insertion. Tolerances for Mach 5 testing demand step heights beneath 5 micrometers to prevent premature boundary layer transition. Optical bench alignment tools map skin topography across sensor boundaries, verifying continuous curvature along smooth vehicle skin panels.
AIAA S-071A adherence sets maximum sensor step height tolerances at 5 micrometers for Mach 5 laminar flow skin evaluation.
Flush mounting maintains boundary layer stability. Pressure tap holes require sharp, burr-free edges perpendicular to the outer surface contour. Tap diameter choices balance pneumatic response speed against spatial resolution, with typical orifice diameters held between 0.5 and 1.0 millimeters.

Pneumatic Lag Corrections for Rapid Blowdown Runs
Blowdown wind tunnels reach steady-state conditions in milliseconds to seconds. Long pressure sensing tubes running from skin taps to remote transducer banks introduce pneumatic attenuation and time delays. Calibration routines execute step-change pressure pulses through the complete tube matrix to determine the system response function.
- Mount the calibration plate into a three-axis optical laser profilometer jig to map surface planar offset.
- Adjust mechanical micrometer stage screws until step heights between sensor diaphragm and skin edge measure under 3 micrometers.
- Apply high-temperature vacuum grease along internal threads to seal dynamic pressure cavities against boundary layer bleed flows.
- Perform zero-flow pneumatic leak checks across pressure tubing manifolds up to 5 megapascals operating pressure.
- Record reference baseline voltages under ambient atmospheric conditions before initiation of tunnel pump-down.
| Aerodynamic Regime | Maximum Step Height (μm) | Maximum Gap Width (μm) | Allowable Roughness R_q (μm) | Pneumatic Tap Diameter (mm) |
|---|---|---|---|---|
| Supersonic (Mach 1.5 to 3.0) | 15.0 | 50.0 | 1.6 | 1.0 |
| High Supersonic (Mach 3.0 to 5.0) | 5.0 | 25.0 | 0.8 | 0.8 |
| Hypersonic (Mach 5.0 to 8.0) | 2.0 | 10.0 | 0.4 | 0.5 |
| High Enthalpy Hypersonic (Mach > 8) | 1.0 | 5.0 | 0.2 | 0.3 |
Adherence to ISO 17025 calibration clauses obligates test directors to reject sensor channels that fail post-run ambient reference re-zeroing.


Noise
Acoustic disturbances generated by nozzle wall boundary layers contaminate freestream flow quality in conventional high-speed wind tunnels. High acoustic noise levels induce premature boundary layer transition on test skins, making transition locations measured in conventional ground facilities unreliable for flight performance extrapolation. Acoustic radiation advances boundary layer transition.
Acoustic Environment and Quiet Tunnel Benchmarking
Conventional blowdown wind tunnels operate with turbulent nozzle wall boundary layers that radiate acoustic Mach waves into the test section core flow. Pressure fluctuation levels in conventional facilities reach 1 to 3 percent of freestream static pressure. Quiet wind tunnels utilize bleed slots in the nozzle throat and maintain laminar nozzle wall boundary layers, reducing freestream noise levels below 0.05 percent.
Calibrated fast-response piezo-resistive and piezoelectric pressure sensors record acoustic spectra inside the tunnel test core. Sensor calibration involves acoustic shock-tube exposures to establish flat frequency response up to 500 kilohertz. Facility noise skews transition location readings.
Conventional wind tunnels exhibit acoustic disturbance levels high enough to trigger boundary layer transition far ahead of flight predictions.
Acoustic-to-vorticity mode conversion inside boundary layers drives Tollmien-Schlichting wave growth or Mack second-mode acoustic instability amplification depending on the Mach number regime. Quantifying freestream pressure fluctuations across the frequency domain provides the baseline correction spectrum needed for stability code calculations.

Pressure Sensitive Paint Frequency Response Limits
Pressure Sensitive Paint (PSP) delivers continuous surface pressure field visualization across complex vehicle skin geometries. Luminophore molecules suspended inside an oxygen-permeable binder fluoresce under ultraviolet light excitation, with luminescence intensity inversely proportional to local oxygen partial pressure.
Dynamic calibration of PSP requires dynamic calibration chambers where acoustic drivers subject painted sample coupons to sinusoidal pressure oscillations up to 20 kilohertz. Paint binder thickness controls oxygen diffusion rates into the coating layer. Thinner paint application improves frequency response while reducing overall light output, demanding high-sensitivity camera acquisition systems during wind tunnel operations.
Wind tunnel data taken without acoustic disturbance profiling remains invalid for flight vehicle boundary layer prediction.


Margin
High-speed wind tunnel testing costs enforce strict optimization of test matrices and calibration run times. Operating facilities at high total pressures and total enthalpy consumes significant power, consumables, and structural fatigue life. High facility fees penalize repeated calibration runs.
Calibration procedures must maximize data yield per second of runtime while holding systematic measurement error within strict bounds.
Facility Occupancy Rate Structures and Test Matrix Optimization
Large-scale supersonic blowdown facilities charge fixed occupancy fees alongside variable consumables charges calculated per second of active run time. Pre-test instrument calibration conducted inside the tunnel test section incurs full hourly occupancy fees, motivating the development of portable, off-line calibration rigs that dock directly to skin test plates.
Calibrated pressure sensors reveal local separation. Offline calibration jigs isolate skin panels within benchtop pressure chambers, executing multi-point sensor verification routines before skin mounting occurs inside the main facility test section. Final pre-run checks in the tunnel reduce to rapid zero-point and single-span verification steps.
| Facility Type | Mach Number Range | Run Duration | Operating Cost per Minute (USD) | Calibration Points per Run |
|---|---|---|---|---|
| Continuous Supersonic Tunnel | 1.5 to 4.0 | Continuous | $450 | 500 |
| High-Pressure Blowdown Tunnel | 2.0 to 6.0 | 10 to 60 seconds | $1,200 | 120 |
| Arc-Jet Thermal Facility | 5.0 to 10.0 | 1 to 15 minutes | $4,800 | 30 |
| Impulse Shock Tunnel | 6.0 to 15.0 | 2 to 10 milliseconds | $18,000 | 1 |

Quantifying Calibration Drift Costs in Multi-Run Test Campaigns
Sensor drift occurring across sequential tunnel runs degrades data fidelity and compromises test objectives. Thermal cycling weakens transducer adhesives and alters bridge balancing electronics. Scheduled mid-campaign recalibrations prevent systematic bias buildup, trading short downtime costs against the expense of invalid test runs.
- Certified freestream disturbance spectra validates that tunnel wall radiation remained within quiet limits during acoustic evaluation runs.
- Dual-sensor heat flux cross-checks confirms coaxial thermocouple and thin-film gage readings agreed within a 3 percent uncertainty band.
- Post-test profilometry scans demonstrates sensor flushness survived thermal expansion without exceeding maximum step height limits.
- Zero-shift thermal compensation logs proves sensor bridge output remained stable under ambient-to-peak temperature swings.
The long-term question remains whether ground facilities can ever achieve freestream quietness levels that eliminate the need for costly empirical flight correlation factors.


Yield
Final acceptance of high-speed vehicle skin designs rests on the delivery of traceable, audited wind tunnel calibration dossiers. Structural release for flight hardware fabrication demands proof that skin panels satisfy boundary layer stability, surface roughness, and thermal resistance criteria under simulated operational environments.

Surface Roughness Thresholds and Manufacturing Tolerances
Surface roughness profiles dictate boundary layer transition onset in high Mach number flows. Manufacturing tolerances for skin panels specify root-mean-square roughness thresholds beneath 0.4 micrometers for Mach 6 flight applications. Roughness elements that exceed local boundary layer displacement thickness act as localized trips, causing premature transition and elevated aerodynamic heating.
Profilometer trace verification logs accompany every skin panel delivered to ground test facilities. Contact optical and laser profilometers capture surface height distributions across three spatial dimensions. Analysis software converts surface maps into power spectral density plots, verifying that surface finish spectrum amplitudes remain below critical instability growth thresholds.
Ground test calibration data without quantified freestream disturbance spectra fails to establish airworthiness for hypersonic skin assemblies.
Surface roughness triggers turbulent spot formation. Post-run inspection maps skin surfaces for erosion, micro-cracking, or ablation-induced surface degradation experienced during high-enthalpy airflow exposure.

Verification Dossier Requirements for Flight Authorization
Flight authorization authorities require complete technical documentation validating all aerodynamic skin measurements taken during wind tunnel qualification campaigns. Verification dossiers collect transducer calibration certificates, facility disturbance logs, optical profilometry scans, and numerical uncertainty analysis files into an audited archive.
- Raw calibration voltage curves provides the fundamental voltage-to-engineering unit conversion matrix for every installed transducer.
- NIST traceable calibration certificates confirms transducer sensitivity coefficients against national measurement reference standards.
- Surface roughness profilometry records documents local surface roughness parameters prior to and following high-speed airflow exposure.
- Uncertainty budget documentation outlines combined systematic and random error components for calculated heat transfer rates.
Once the validation dossier passes peer review, skin panel structural drawings receive formal release for production casting and thermal barrier coating application.