Aerothermal Shock Interaction Heat Transfer Mapping Procedures for Composite Airframes
Shock-induced aerothermal heating on composite airframes requires inverse multidimensional heat flux reduction to prevent anisotropic conduction mapping errors.


Gradient

Baseline Thermal Loads and Mach Intersections
Shock interactions on hypersonic airframes generate intense localized thermal spikes. At Mach numbers above 5, oblique shocks impinging on boundary layers produce Type IV and Type IVa interference patterns. These shock-on-shock interactions yield peak heating rates exceeding baseline laminar stagnation values by factors of ten to thirty.
Composite airframes built from carbon-fiber-reinforced polymer or carbon-carbon composites exhibit directional thermal conductivities that amplify localized thermal gradients. Structural qualification requires continuous mapping of heat transfer coefficients across these impingement zones to prevent structural delamination.
Aerothermal shock interaction occurs when an externally generated shock wave intersects the bow shock or boundary layer of an airframe component. The interaction displaces the sonic line, generating supersonic jets directed straight toward the surface. Peak heat flux values in these localized regions regularly pass 15 megawatts per square meter within a footprint measuring less than 20 millimeters in width.
The structural response of a composite skin depends heavily on the ratio of transverse to longitudinal thermal diffusivity. An uncalibrated estimate produces thermal stress spikes that exceed matrix interlaminar shear allowable limits within hundreds of milliseconds.
Transverse thermal gradients across thin-ply composite laminates generate interlaminar shear stresses that cause subsurface delamination before surface resin reaches pyrolysis temperatures.
Qualification procedures demand exact spatial and temporal resolution during ground-test campaigns. Standard continuous-flow wind tunnels lack the enthalpy levels needed to reproduce real gas effects and structural shocks simultaneously. Consequently, test protocols rely on reflected shock tunnels, expansion tubes, and arc heaters.
Each test facility introduces distinct flow establishment times and measurement constraints. Mapping procedures combine high-speed optical diagnostics with surface-embedded instrumentation arrays to capture the movement of shock footprints across the airframe geometry.


Footprint
Interference Types and Energy Transfer Zones
The Edney shock interaction taxonomy classifies interference into six distinct patterns based on the relative geometry of the intersecting shocks. Type IV interactions present the most severe aerothermal challenge. In this pattern, an oblique shock strikes the bow shock near the subsonic region, producing a supersonic shear layer and an embedded jet.
This jet terminates in a normal shock close to the airframe wall, creating a stagnation point characterized by thin boundary layers and extreme recovery temperatures.
Type III interactions involve shear layer reattachment directly onto the composite skin. Heat transfer rates along the reattachment line rise to five to eight times baseline levels, accompanied by large acoustic loads and localized pressure variations. Type I and Type II interactions, while characterized by lower peak heat fluxes, cover broader surface areas, introducing wide-area thermomechanical bending moments.
Composite substructures require tailored fiber architectures to balance the thermal loads created by these shifting interaction regions during atmospheric reentry or hypersonic transit maneuvers.
| Interaction Type | Flow Field Mechanism | Peak Pressure Multiplier | Peak Heat Flux Multiplier | Impingement Footprint Width |
|---|---|---|---|---|
| Type I | Crossed oblique shocks with regular or Mach reflection | 1.5 to 3.0 | 1.8 to 3.5 | 35 to 80 mm |
| Type II | Oblique shock impinging on curved bow shock | 2.5 to 5.0 | 3.0 to 6.5 | 20 to 50 mm |
| Type III | Shear layer attachment with subsonic recirculating bubble | 4.0 to 8.0 | 5.0 to 9.0 | 15 to 35 mm |
| Type IV | Supersonic jet impingement with normal terminal shock | 10.0 to 25.0 | 12.0 to 28.0 | 3 to 18 mm |
| Type V | Shock-induced boundary layer separation and triple point | 3.0 to 6.0 | 4.0 to 7.5 | 25 to 60 mm |
Capturing the physical dimensions of these zones requires optical diagnostics capable of resolving spatial gradients down to 0.1 millimeters. Schlieren imaging coupled with ultra-high-speed CMOS sensors establishes the instantaneous position of the triple point and jet. Without concurrent surface thermography, optical diagnostics fail to account for wall temperature feedback and boundary layer displacement effects.
The mapping procedure integrates flowfield imaging directly with substrate thermal response models.
Uncertainties expand when tracking moving interaction zones over compliant panels. Mechanical deflection changes the impingement angle, which shifts the interaction class between Type III and Type IV dynamically.


Sensor

Instrument Selection and Surface Metrology
Mapping heat transfer rates across dynamic shock zones requires instrumentation that balances temporal response, spatial resolution, and survivability. Discrete point sensors capture fast transient phenomena, while full-field optical methods document spatial thermal gradients. Shock tunnel run durations often range between 2 and 20 milliseconds, leaving zero tolerance for thermal sensor lag.
Coaxial thermocouple gauges use two concentric metallic elements separated by a thin insulating layer. The active thermal junction forms at the polished sensing surface. Chromel-constantan or iron-constantan coaxial assemblies achieve 95 percent response times below 10 microseconds.
Platinum thin-film resistance gauges deposited on quartz, Macor, or ceramic inserts yield microsecond-level response rates. These thin films operate on the principle of one-dimensional transient heat conduction into a semi-infinite substrate, requiring accurate values for substrate thermal product (density, specific heat, and thermal conductivity) to convert temperature histories into wall heat flux.
- Coaxial thermocouples provide high mechanical durability in particulate-laden flows with continuous measurement up to 1200 kelvin.
- Thin-film resistance gauges deliver microsecond temporal response suited for low-enthalpy impulse facilities, though surface erosion limits life in high-enthalpy arc jets.
- Atomic-layer thermopiles generate direct voltage signals proportional to heat flux using thin multi-layer stacks, eliminating indirect conversion models.
- Phosphor thermometry tracks temperature-dependent emission lifetimes using laser-induced phosphorescence, offering non-intrusive full-field thermal maps without wires.
Temperature-sensitive paints apply luminescent molecules embedded in oxygen-permeable or gas-impermeable polymer binders. Excited by near-ultraviolet illumination, these paints emit light inversely proportional to temperature or local pressure. Fast-response formulations record frame rates up to 50 kilohertz.
Calibration requires testing against reference thermocouples within an isothermal calibration chamber, compensating for illumination field non-uniformities and dye photobleaching.
Temperature-sensitive paint coatings thicker than 25 micrometers introduce conductive lag that systematically attenuates peak heat flux readings across narrow shock footprints.
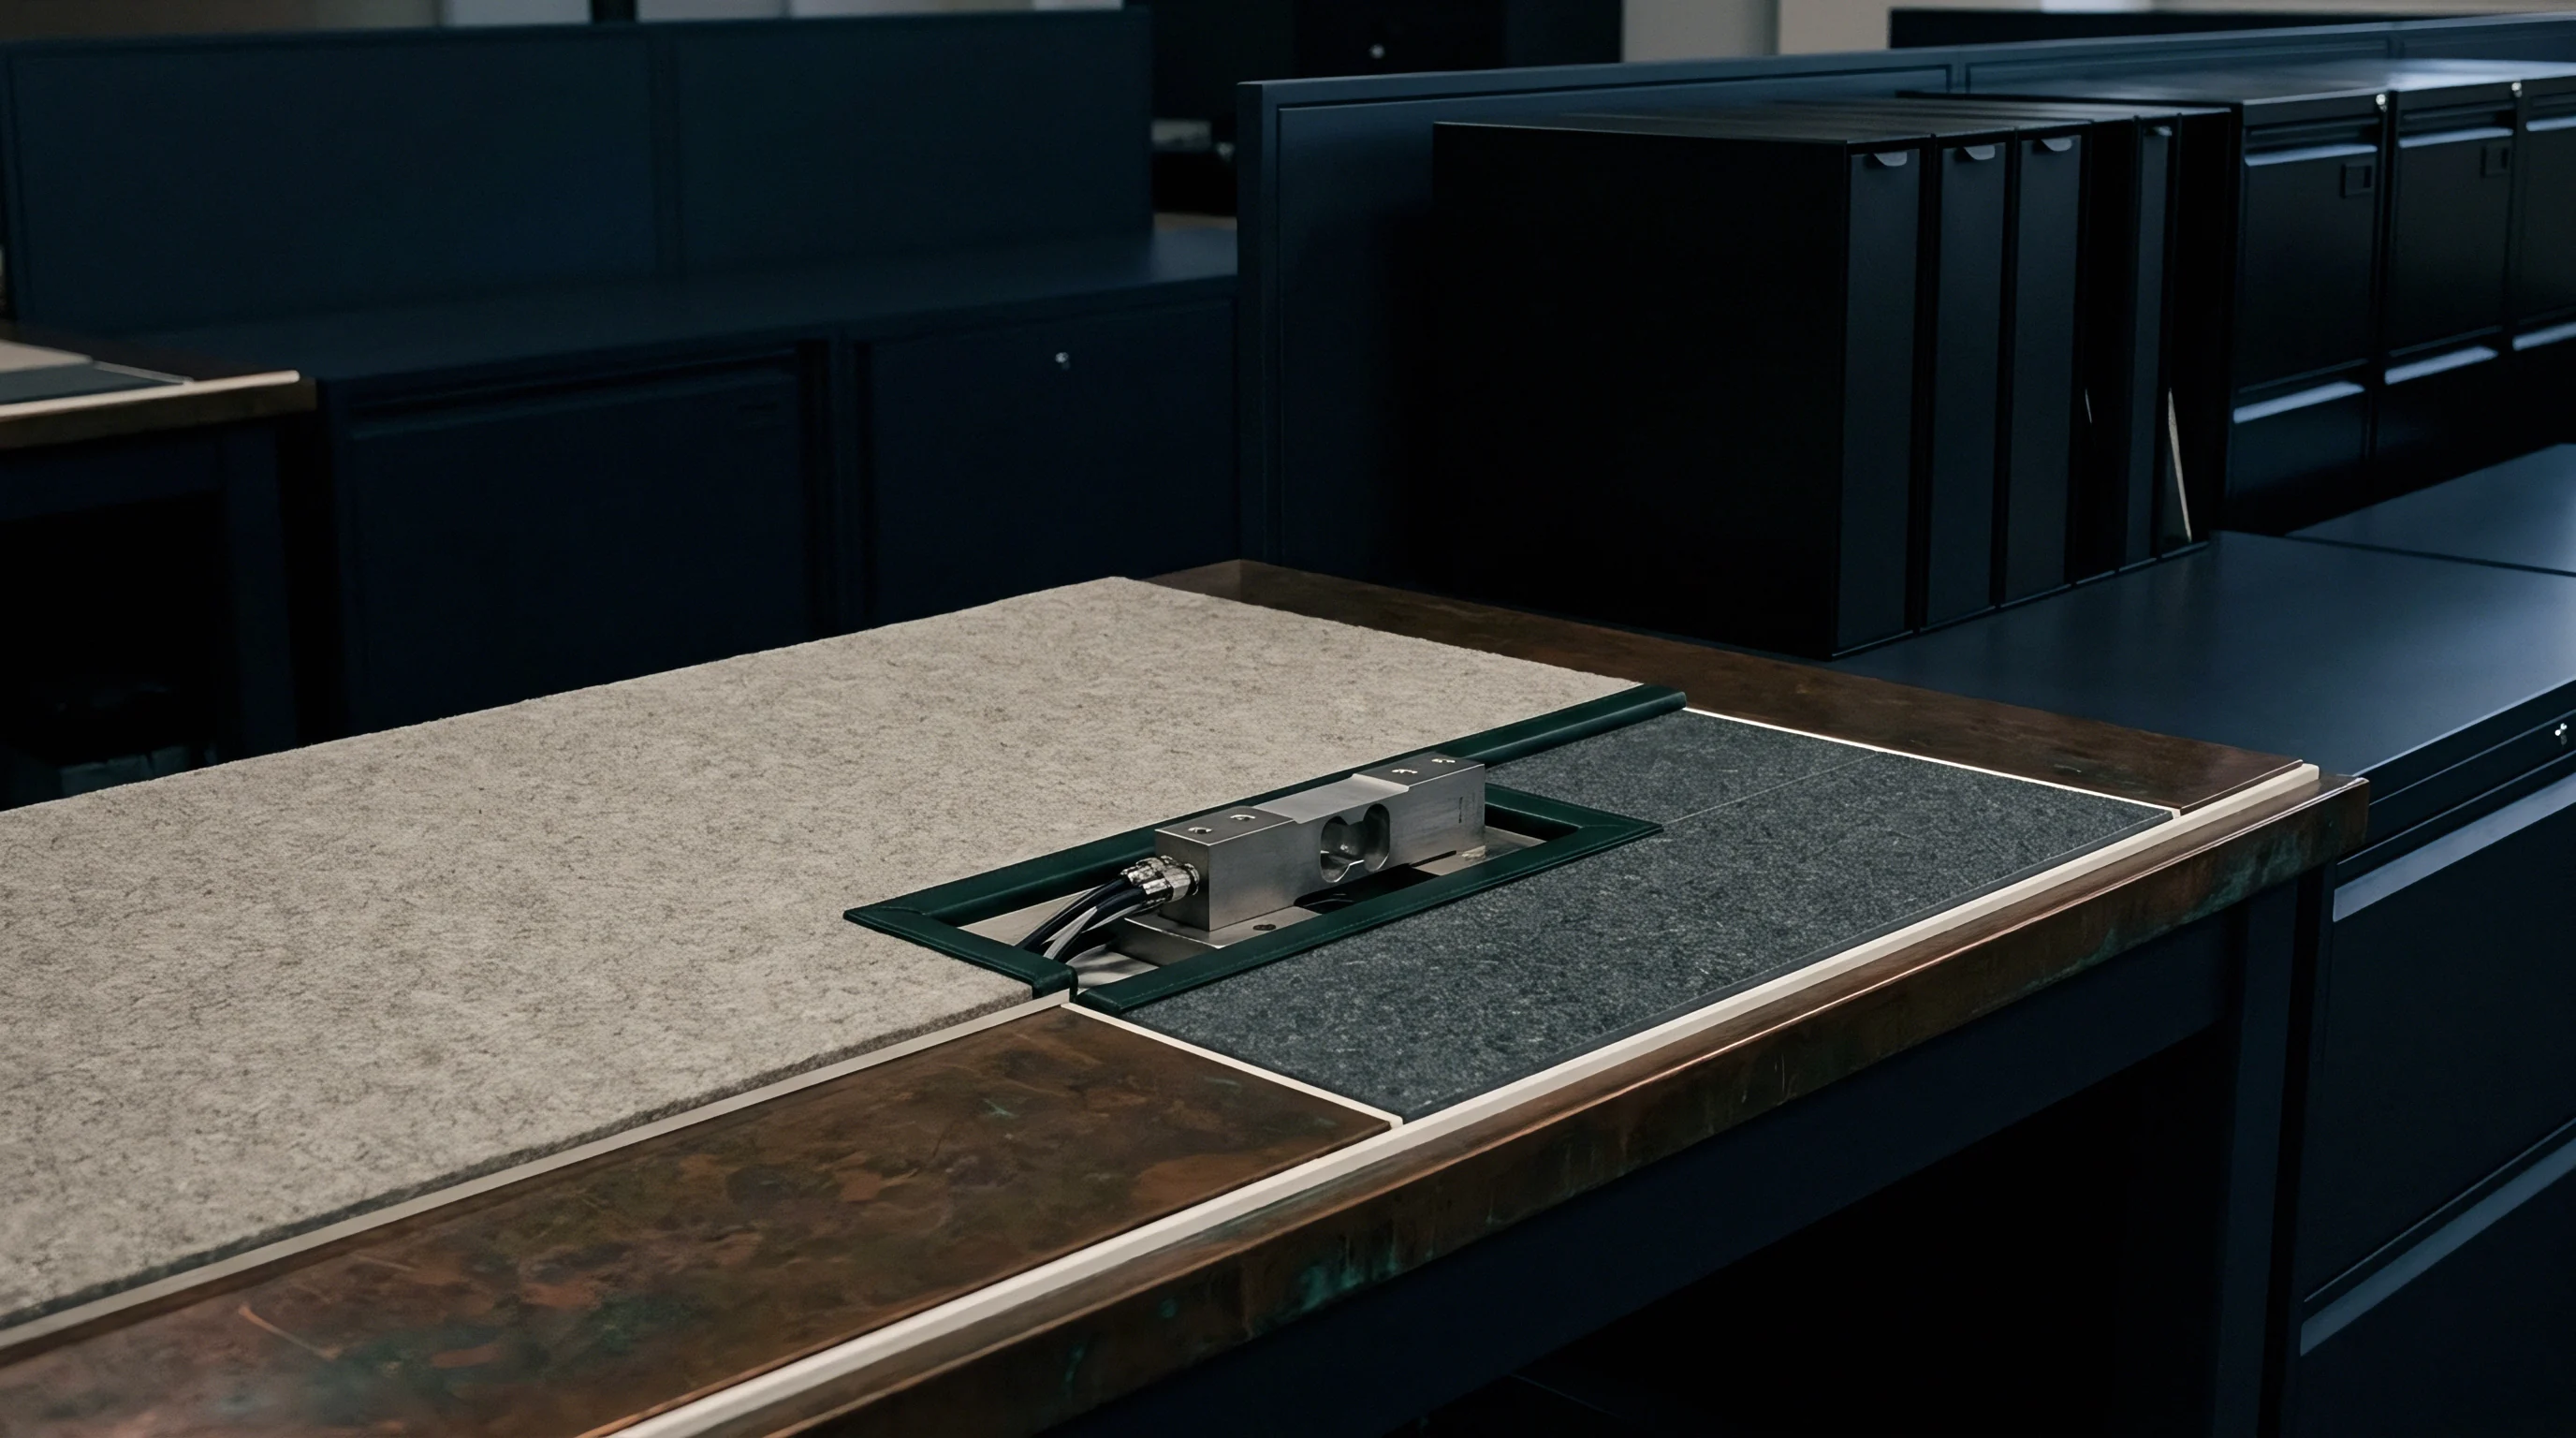
Applying surface instrumentation directly onto composite substrates introduces thermal property mismatches. Metallic sensor inserts possess thermal conductivities orders of magnitude higher than composite resin matrices. The resulting local thermal sink effect distorts the surrounding temperature field, leading to underestimated heat transfer coefficients.
Isolating sensor plugs with low-conductivity ceramic sleeves mitigates this error during transient calibration runs.

Conduction

Anisotropic Diffusion and Pyrolysis Coupling
Carbon-fiber reinforced polymer skins transmit heat along reinforcing fibers up to twenty times faster than through the resin thickness. In carbon-carbon composites, planar thermal conductivity ranges between 40 and 150 watts per meter-kelvin, while through-thickness values drop to 5 to 15 watts per meter-kelvin. Standard one-dimensional heat flux reduction techniques break down in the presence of these directional properties.
The Cook-Felderman algorithm and classical Fourier transforms assume a homogeneous, isotropic semi-infinite solid. When applied directly to composite test models, these algorithms produce calculated heat fluxes with errors exceeding 40 percent. Resolving the true heat transfer coefficient requires inverse heat conduction algorithms governed by the three-dimensional anisotropic energy equation.
The algorithm solves for heat flux by minimizing the objective function between calculated back-surface or embedded sensor readings and the experimental surface temperature history.
High thermal loads trigger resin degradation in polymeric matrices. At temperatures above 550 kelvin, epoxy and bismaleimide matrices undergo endothermic decomposition, venting pyrolysis gases into the boundary layer. This transpiration phenomenon thickens the boundary layer, altering shock interaction boundaries and dampening local heat flux rates.
Accurate mapping routines decouple convective aerothermal heating from endothermic decomposition sinks and surface recession profiles.
Finite element inverse schemes account for temperature-dependent property changes in the composite. As resin carbonizes into porous char, thermal conductivity drops while emissivity rises. Dynamic optical pyrometry mappings must continuously update the assumed surface emissivity values, transitioning from 0.85 for virgin composite materials up to 0.95 for fully carbonized matrices.
The engineer balances spatial grid resolution against inversion algorithm convergence stability to prevent high-frequency noise amplification from corrupting the calculated thermal fields.


Test

Impulse Facilities and Enthalpy Calibration
Simulating shock-shock interactions requires ground facilities that replicate high Mach numbers, unit Reynolds numbers, and total flow enthalpies. Reflected shock tunnels produce reservoir temperatures up to 6000 kelvin and pressures up to 100 megapascals, offering test durations between 3 and 10 milliseconds. Expansion tubes accelerate the flow without bringing gas to a complete stagnation state, preserving chemical purity and producing velocities exceeding 7 kilometers per second for durations under 2 milliseconds.
Test models incorporate representative airframe geometries, such as cylindrical leading edges intersected by upstream wedge-generated shock generators. Adjusting shock generator deflection angles sweeps the interaction region across the instrumentation array. Repeatability protocols demand multiple tunnel shots under identical stagnation conditions to quantify flow field variance.
- Pre-run calibration sweeps establish dark current, illumination intensity field profiles, and baseline sensor resistances across the airframe test model.
- Flow initialization monitoring identifies nozzle startup time and flow establishment via static wall pressure transducers and Pitot rakes.
- Data acquisition synchronization triggers high-speed cameras, pulsed lasers, and analog-to-digital digitizers within a two-microsecond timing window.
- Post-run surface characterization inspects the composite skin for micro-cracking, resin mass loss, delamination, and coating integrity changes.
Facility air supply contaminants introduce measurement drift. Diaphragm fragments and trace particulates impact thin-film resistance gauges, inducing resistance shifts that register as false heat flux spikes. Test protocols mandate post-test electrical continuity and calibration verification before incorporating transient data into composite heat flux matrices.
Free-stream flow enthalpy determinations rely on Pitot pressure and reservoir total temperature estimates. Departures from chemical equilibrium within expansion nozzles require non-equilibrium Navier-Stokes computations to establish free-stream species concentrations and recovery enthalpy fields accurately.
Ground testing facilities present unavoidable run-to-run variations in reservoir burst pressure, altering flow timing characteristics.

Reduction
Worked Inversion for Anisotropic Substrates
Converting surface temperature distributions into quantitative heat transfer rates requires systematic numerical data reduction. Assume an axisymmetric carbon-phenolic leading edge skin undergoing a Type IV shock interaction inside an impulse facility. Free-stream flow properties yield a total enthalpy of 8.5 megajoules per kilogram at Mach 7.
The composite skin thickness is 6.0 millimeters, with longitudinal thermal conductivity parallel to fibers at 85 watts per meter-kelvin and through-thickness conductivity at 6.2 watts per meter-kelvin.
An embedded array of coaxial thermocouples records the transient temperature history at 1.0 megahertz sampling rates. Over a 5.0 millisecond test window, the localized peak surface temperature rises from 295 kelvin to 740 kelvin. Applying a standard 1D semi-infinite isotropic reduction model with nominal bulk properties yields an apparent peak heat flux of 18.2 megawatts per square meter.
| Data Reduction Methodology | Assumed Heat Flow Dimension | Thermal Conductivity Assignment | Calculated Peak Heat Flux | Error Relative to Inverse 3D |
|---|---|---|---|---|
| Classical Cook-Felderman | 1D semi-infinite | Isotropic (12.0 W/m-K) | 18.2 MW/m² | +23.8% |
| Modified 1D with Transverse Correction | 1D with radial loss term | Orthotropic (k_long = 85, k_trans = 6.2) | 16.1 MW/m² | +9.5% |
| Finite Difference 2D Axisymmetric | 2D planar/radial | Orthotropic temperature-dependent | 15.2 MW/m² | +3.4% |
| Full 3D Inverse Heat Conduction | 3D volumetric | Full tensor orthotropic with charring | 14.7 MW/m² | Baseline (Reference) |
The standard 1D model overestimates surface heat flux by approximately 24 percent because it ignores lateral heat conduction moving away from the narrow 4-millimeter interaction band along high-conductivity carbon fibers. The multi-dimensional inverse algorithm resolves this lateral dissipation. It solves the localized thermal field via spatial regularization, reconstructing the authentic heat flux delivered by the supersonic jet without distortion from internal substrate spreading.
Ignoring multidimensional conductive spreading along carbon fiber tows artificially inflates calculated peak aerothermal shock heating values by up to thirty percent.
Spatial filtering prevents high-frequency experimental voltage fluctuations from translating into erratic heating spikes. Tikhonov second-order regularization constrains spatial derivative oscillations while preserving the sharp heat transfer gradient across the shock attachment line. The resulting output establishes accurate convective heat transfer coefficients across the airframe envelope.

Integrity

Interlaminar Shear and Matrix Degradation
Thermal gradients induced by shock interactions translate directly into thermomechanical strain fields. In composite materials, differing coefficients of thermal expansion between fibers and polymer matrix generate substantial microscopic residual stresses. Along the 0-degree and 90-degree ply interfaces, thermal shock loads induce interlaminar normal stresses exceeding matrix tensile capacity, provoking delamination blisters beneath the surface.
Thermomechanical mapping couples surface heat flux profiles directly to finite element structural mechanics models. For a high-enthalpy Type IV impingement lasting 200 milliseconds, through-thickness thermal gradients routinely exceed 100 kelvin per millimeter. The resulting differential thermal expansion creates high transverse shear stresses along ply boundaries located 0.5 to 1.5 millimeters below the skin surface.
Non-destructive evaluation techniques assess internal composite health following thermal wind tunnel exposures. High-frequency pulse-echo ultrasound maps internal acoustic impedance shifts, pinpointing resin-fiber debonding and localized core crushing. X-ray micro-computed tomography provides spatial characterization of matrix micro-crack density, displaying void consolidation along the heat-affected footprint.
Composite design limits set allowable shear stress thresholds below standard ambient values to account for thermal softening. When resin temperatures approach the glass transition point, matrix shear modulus plummets, accelerating structural buckling under coincident aerothermal and aerodynamic pressure loads.
Subcontractor quality documentation often relies on standard coupon tensile tests, omitting the combined high-rate heat flux and pressure gradients necessary to expose composite interface failure limits.
Dossier

Qualification Deliverables and Airframe Acceptance
Certification of composite hypersonic components demands an integrated aero-thermo-structural data package. Ground test mapping campaigns generate gigabytes of raw time-series data, high-speed imagery, and inverse numerical reductions. The final qualification package harmonizes these experimental readings with high-fidelity aerothermal CFD simulations to validate airframe performance across the design flight envelope.
CFD modeling utilizes detached eddy simulation and Reynolds-averaged Navier-Stokes approaches equipped with shear-stress transport turbulence models. Unvalidated aerothermal models underestimate heat flux in shock interaction zones due to poor turbulent kinetic energy prediction across shock-boundary layer interactions. Ground test mapping files furnish the anchor points required to tune turbulence damping parameters, ensuring accurate flight environment extrapolation.
Airworthiness acceptance relies on documented testing protocols conforming to high-temperature aerodynamic test criteria. Compliance records establish thermal safety margins by showing that maximum predicted operational heat flux values, including shock interactions, remain within verified composite thermal protection boundaries.
The standard operating procedures set forth in commercial defense contracts govern allowable test-to-simulation variance levels, holding acceptable heat transfer coefficient spreads to within plus or minus fifteen percent across certified flight regimes.