Standardized Capillary Rheometry Quality Control Testing for Composite Prepregs
Standardized capillary rheometry verifies prepreg matrix shear viscosity and B-stage advancement at processing shear rates before committing rolls to manufacturing.
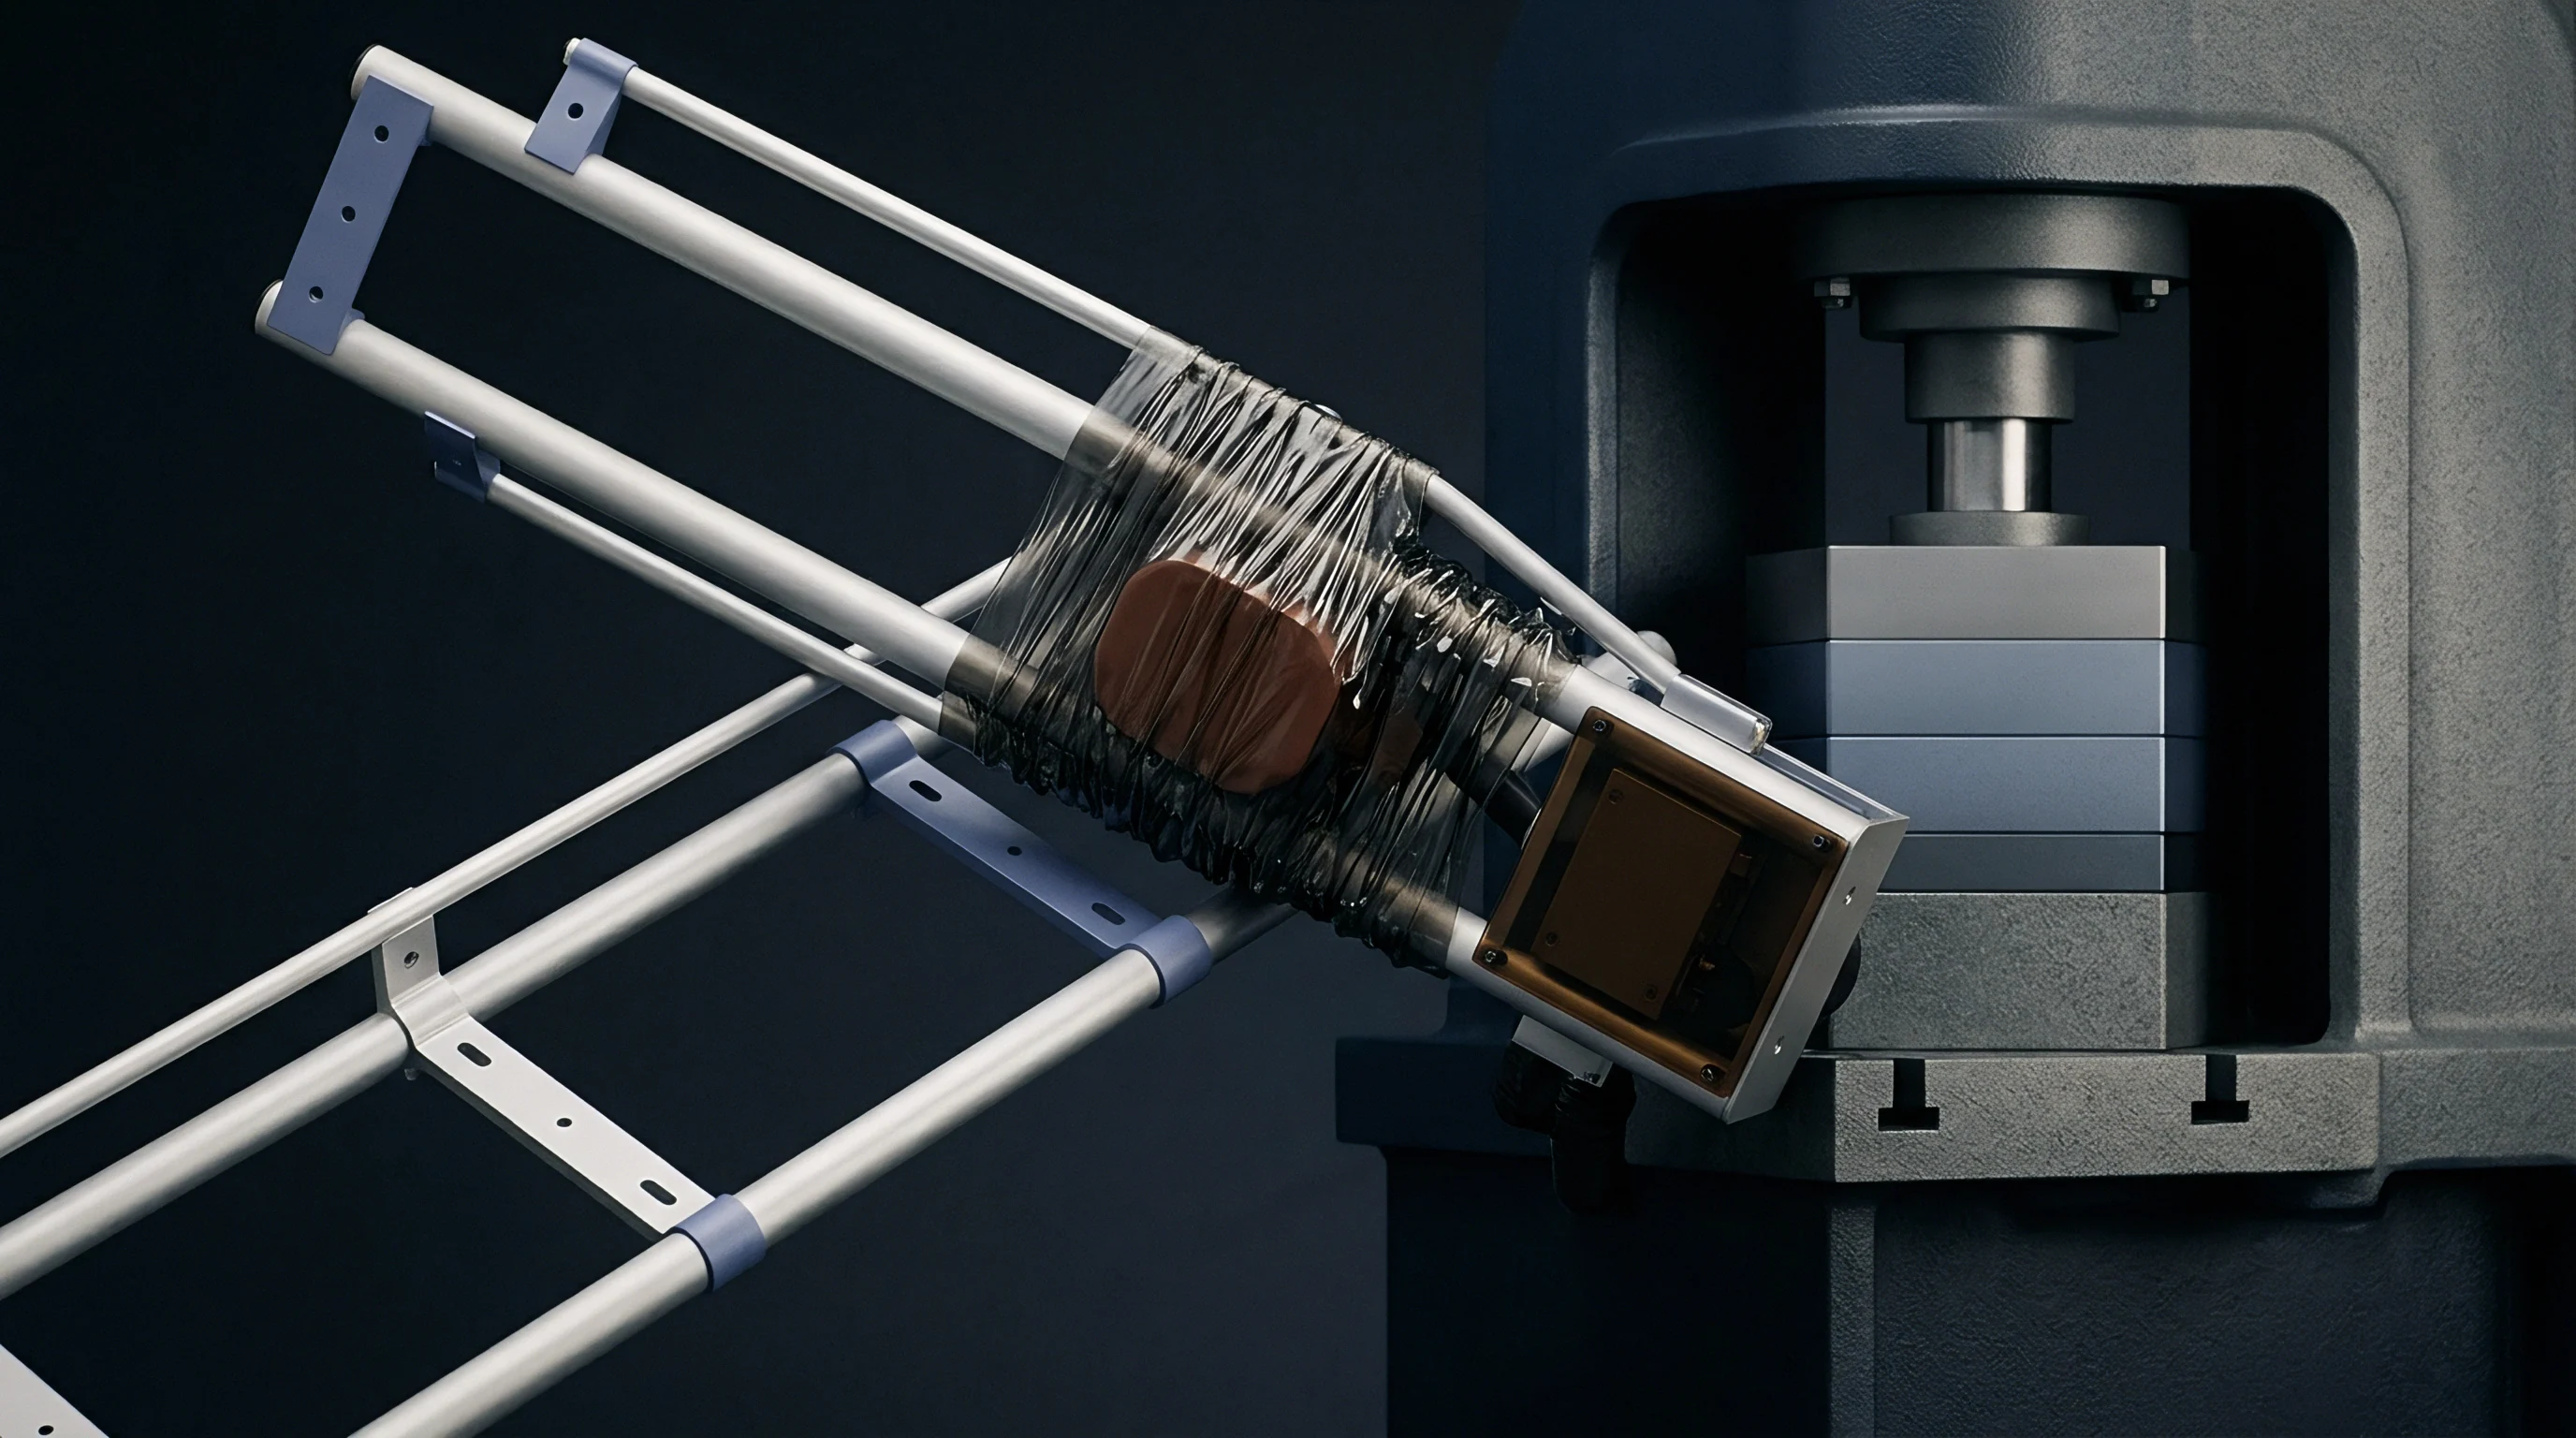

Die
High-pressure capillary extrusion instruments evaluate resin matrices extracted from structural prepregs by forcing fluid through tungsten carbide orifices under controlled thermal conditions. As fluid converges toward the capillary entry zone, it undergoes severe extensional deformation along streamlines before entering the main cylindrical channel. Reliable quality testing depends on distinguishing true shear resistance along the capillary wall from pressure drops generated at the die entrance.
Thermoset epoxy systems, polyetheretherketone melts, and toughened bismaleimide formulations exhibit pronounced entrance losses that distort apparent viscosity calculations if uncorrected. Test barrels fitted with precision pressure transducers monitor upstream force, capturing load profiles as a piston forces matrix fluid through dies with length-to-diameter ratios spanning ten to thirty.
Flat entrance dies with ninety-degree entry angles create recirculating vortices at orifice corners, absorbing mechanical energy and artificially elevating recorded pressure drops. Tapered capillary entries that mitigate corner stagnation alter extensional stress distributions, yielding lower entrance losses while complicating geometry-independent data conversions. Slit capillary dies present an alternative geometry for filled matrix resins, maintaining planar shear flow between parallel plates and minimizing particle jamming near orifice inlets.
Pressure distribution measurements along a slit die using flush-mounted transducers isolate true wall shear stress without requiring multi-length die arrays. Choosing between cylindrical orifices and planar slit geometry dictates barrel charge volumes, cleaning durations between sampling batches, and transducer sensitivity ranges required for low-viscosity thermoset resins prior to crosslinking.
| Die Geometry Type | Capillary Diameter (mm) | Length-to-Diameter Ratio | Entry Angle (Degrees) | Typical Entrance Loss Ratio (% Total P) |
|---|---|---|---|---|
| Standard Short Orifice | 1.00 | 5.0 | 180 | 38.5 to 52.0 |
| Standard Long Orifice | 1.00 | 20.0 | 180 | 12.0 to 18.5 |
| Extended Reference Orifice | 1.00 | 30.0 | 180 | 8.0 to 12.5 |
| Conical Entry Orifice | 1.00 | 20.0 | 90 | 6.2 to 11.0 |
| Planar Slit Die | 0.50 (Gap) | 25.0 (L/H) | 180 | 4.5 to 9.0 |

Capillary Geometry Selection and Entrance Effects
Accurate measurements require capillary channel dimensions that balance transducer signal clarity against mechanical degradation of matrix polymers. Short capillaries with length-to-diameter ratios below ten yield total pressure signals dominated by entrance loss dynamics rather than fully developed laminar shear flow. Long capillaries with ratios exceeding thirty minimize relative entrance contributions, but introduce severe viscous heating risks at elevated piston velocities.
Resins containing inorganic particulate tougheners or residual micro-fibers extracted from prepreg architecture mandate orifice diameters of at least one millimeter to prevent particle bridging, localized clogging, and transient pressure spikes during testing.
Flush-mounted pressure transducers positioned directly within the capillary wall eliminate entrance and exit corrections entirely by recording local static pressure gradients along fully developed flow regions. Spatial constraints in small laboratory barrels often preclude multi-transducer wall installations, requiring operators to collect pressure data across multiple interchangeable dies. Testing at fixed volumetric throughput across three capillary dies with varying channel lengths establishes accurate baseline measurements.
Linear extrapolation of total extrusion pressure plotted against capillary length-to-diameter ratio yields entry pressure loss values at the zero-length intercept.
Standardized quality limits require entrance loss corrections across three distinct capillary die lengths prior to matrix viscosity certification.
Resin viscosity values calculated without entrance corrections overestimate true shear resistance by thirty to fifty percent at shear rates exceeding five hundred reciprocal seconds. Prepreg matrix resin batches certified against uncorrected single-die measurements obscure batch-to-batch variations in molecular weight distribution and elastic behavior. High extensional viscosity components in toughened aerospace epoxies trigger early flow instabilities, shifting the effective capillary entrance length and distorting apparent flow curves.
Standardized quality control protocols enforce mandatory entrance loss correction procedures for every material lot destined for primary structural composite manufacturing.

Bagley Pressure Corrections in Matrix Testing
Linear Bagley plots map total measured extrusion pressure against capillary length-to-diameter ratios at constant shear rates, producing straight regression lines that intercept the pressure axis above zero. Non-linear Bagley plots signal viscoelastic phenomena, molecular orientation changes, or pressure-dependent matrix viscosity shifts inside the barrel channel. High-performance thermoplastic matrix resins like polyetherketoneketone demonstrate strong pressure-dependent viscosity behaviors above fifty megapascals.
Nonlinear regression models applied to Bagley data isolate hydrostatic pressure sensitivity coefficients, separating entry stress effects from true high-pressure channel friction.
Piston alignment within the heated barrel directly affects pressure transducer fidelity during low-viscosity resin evaluations. Off-center alignment generates mechanical friction between piston seals and barrel walls, injecting false force values into load cell signals. Thermal equilibrium across the barrel and capillary die assembly must be maintained within zero point one degree Celsius to prevent thermal expansion variations that alter internal channel dimensions.
Cold spots located near die retaining nuts cause local matrix cooling, elevating exit pressure resistance and artificially twisting Bagley plot slopes toward higher apparent viscosity outcomes.
Extraction solvent traces remaining in matrix samples alter entrance loss profiles by plasticizing polymer chains and lowering extensional viscosity response. Prepreg matrix extraction using volatile organic solvents requires multi-stage vacuum drying cycles verified by gas chromatography before loading resin charges into capillary barrels. Thermal history during solvent removal must remain below reaction initiation thresholds to avoid premature crosslinking in B-staged thermoset samples.
Failure to eliminate solvent residues leads to falsely depressed Bagley entrance pressure intercepts and invalid quality acceptance reports.

Slit Orifice Dynamics for Fiber Filled Resin Extraction
Planar flow geometries generated within rectangular slit dies eliminate convergence symmetry inherent to axisymmetric cylindrical orifices. Transducers mounted directly along the wider planar wall measure pressure drops in fully developed shear flow, bypassing entry and exit corrections. Aspect ratios between slit width and gap height exceeding ten to one preserve two-dimensional flow conditions, preventing side-wall drag from distorting shear rate calculations.
Testing high-viscosity thermoplastic prepregs containing short carbon fibers or rubber toughening spheres through slit geometries reduces fiber alignment variations across the test channel.
Slit die cleanout cycles require specialized solvent flushes and mechanical scraping tools to remove degraded polymer residue without marring precision ground surfaces. Mechanical damage to slit walls creates localized flow channels, causing wall slip and severe pressure fluctuations during subsequent testing runs. Precision gauge blocks measure channel gap tolerances to within two micrometers following cleanout, verifying geometric stability prior to barrel preheating.
Instrument software updates channel gap dimensions in shear stress equations to preserve absolute viscosity calibration accuracy over thousands of operating hours.
Flow field transitions occurring where matrix fluid exits the capillary or slit channel induce extrudate swell driven by elastic energy recovery. Measuring swell ratios with non-contact laser micrometers yields secondary quality control metrics reflecting resin elasticity and polymer chain branching variations. Polymer lots exhibiting identical steady-state shear viscosity profiles often present distinct extrudate swell behaviors due to subtle shifts in molecular weight tails.
Incorporating swell ratio limits into receiving inspection criteria prevents off-spec resin lots from causing web distortion during automated tape laying operations.
Discrepancies between raw transducer traces and certified resin flow curves usually trace back to inadequate thermal equilibration during barrel preconditioning. Single-point pressure readings collected before thermal field stabilization produce apparent viscosity errors exceeding twenty-two percent across aerospace epoxy samples. Erratic shear stress spikes during lot qualification runs, initially attributed to barrel wall friction, were shown by multi-die Bagley corrections to stem from localized resin gelation rather than instrument drag.


Shear
Capillary rheometers impose high shear rates on matrix resins, replicating fluid dynamics encountered during automated fiber placement consolidation and high-pressure autoclave compaction. Non-Newtonian shear-thinning characteristics dominate resin behavior as polymer chains uncoil and align along high-velocity streamlines inside capillary dies. Apparent shear rates derived from piston speed and capillary dimensions assume parabolic velocity profiles characteristic of Newtonian fluids.
Polymer matrices deviate from parabolic flow, requiring mathematical transformations to calculate true shear rates at the capillary wall. Standardized quality control procedures specify exact shear rate test bands matched to processing conditions expected on factory floors.
Measuring matrix response across shear rates ranging from ten to ten thousand reciprocal seconds highlights structural variations between resin batches. Thermoset resins containing core-shell rubber tougheners exhibit shear-thinning indices that shift dramatically when shear stress exceeds critical threshold values. Matrix viscosity drops precipitously at elevated shear rates, enabling matrix flow through dense fiber architectures without disturbing structural alignment.
High shear rate testing exposes subtle formulation errors, such as improper catalyst concentrations or crosslinker stoichiometry variations, which remain undetected during low-shear oscillatory testing.
| Resin Matrix Classification | Test Temperature (°C) | Target Shear Rate Range (s⁻¹) | Apparent Viscosity Range (Pa·s) | Power-Law Index (n) |
|---|---|---|---|---|
| Aerospace Toughened Epoxy (180°C Cure) | 120 | 100 to 5,000 | 0.85 to 12.40 | 0.42 to 0.58 |
| Industrial Fast-Cure Epoxy | 80 | 500 to 10,000 | 0.12 to 2.10 | 0.65 to 0.78 |
| High-Temperature BMI | 150 | 100 to 2,500 | 1.50 to 18.20 | 0.50 to 0.62 |
| PEEK Thermoplastic Matrix | 380 | 200 to 8,000 | 120.00 to 850.00 | 0.35 to 0.45 |
| Low-Density Polyetherimide (PEI) | 340 | 100 to 5,000 | 210.00 to 1,450.00 | 0.38 to 0.48 |

Apparent Shear Rate Corrections for Non Newtonian Resins
True wall shear rate calculations demand applying the Rabinowitsch-Mooney correction to raw volumetric flow rate data collected from capillary extrusions. Non-Newtonian matrix fluids exhibit blunted velocity profiles across die channels, generating higher wall shear rate gradients than Newtonian profiles predict. The logarithmic derivative of volumetric flow rate plotted against wall shear stress establishes the non-Newtonian slope factor used in Rabinowitsch-Mooney adjustments.
Failure to apply this correction yields wall shear rate errors ranging from fifteen to forty percent depending on the fluid power-law index.
Multi-point shear rate sweeps must maintain steady-state flow conditions at each piston speed step before recording force measurements. Transient stress response during piston velocity changes introduces inertial artifacts into pressure readings, corrupting non-Newtonian slope calculations. Automating baseline pressure checks before each shear rate step verifies structural stability of matrix fluid inside the test barrel.
Non-linear power-law curves signal structural changes within resin samples, such as heat-induced cure progression or filler network breakdown under extreme velocity stress.
Automated processing of Rabinowitsch-Mooney adjustments requires clean pressure data free from digital noise and mechanical motor vibrations. High-frequency electrical filtering applied to transducer signals removes mechanical ripple while preserving genuine stress fluctuations caused by polymer flow instabilities. Viscosity data sheets issued by material suppliers specify whether published shear rates represent raw apparent values or Rabinowitsch-Mooney corrected true values.
Standardized receiving specifications enforce true shear rate reporting to ensure direct comparability across testing laboratories.

Viscous Heating Dissipation in Narrow Capillaries
Internal friction generated during high-shear capillary extrusion converts mechanical energy directly into heat, raising matrix temperature along the die centerline. Viscous dissipation creates thermal gradients across the capillary diameter, depressing matrix viscosity near the center while maintaining higher viscosity along colder capillary walls. The Brinkman number quantifies the ratio of viscous heat generation to thermal conduction through die walls, providing a threshold parameter for thermal instability.
When Brinkman numbers exceed zero point five, localized temperature spikes alter polymer flow behavior, rendering isothermal viscosity calculations invalid.
Capillary dies constructed from high thermal conductivity materials such as copper-beryllium alloys or specialized tungsten carbide compounds mitigate internal thermal gradients. Active fluid heating jackets surrounding capillary dies evacuate excess thermal energy rapidly during high shear rate test sweeps. Thermocouples embedded within capillary wall structures monitor die temperature rises during continuous extrusion cycles.
Thermoset epoxy resins exposed to localized viscous heating risk rapid thermal runaway, accelerating cure reactions and clogging capillary channels with gelled thermoset residue.
Viscous heating inside capillary channels exceeding zero point five degrees Celsius voids isothermal flow assumptions and corrupts shear viscosity data.
Correction algorithms adjust recorded viscosity values for heat generation effects using non-isothermal flow models linked to fluid thermal temperature coefficients. Input parameters for viscous heating corrections require precise thermal conductivity and specific heat measurements of matrix resins across processing temperature ranges. Piston drive profiles utilizing short extrusion pulses instead of continuous flows limit total mechanical work dissipated into matrix samples.
Pulsed extrusion testing preserves isothermal conditions during shear sweeps exceeding five thousand reciprocal seconds.

Wall Slip Detection in Thermoplastic Prepregs
High molecular weight thermoplastic matrix resins extruded through polished steel capillaries frequently experience wall slip phenomena along die surfaces. Slip occurs when fluid shear stress exceeds critical interfacial adhesive strength, causing polymer chains to detach from metallic capillary walls. Wall slip distorts calculated viscosity values by creating false impressions of rapid shear-thinning behavior at elevated extrusion pressures.
Standardized quality testing must detect slip initiation to prevent misinterpreting slip velocity as true polymer bulk flow.
Identifying wall slip requires testing matrix charges through multiple capillary dies sharing identical length-to-diameter ratios but possessing different channel diameters. Plotting apparent shear rate against the inverse of capillary radius at constant wall shear stress yields linear plots whose slope quantifies true slip velocity. A non-zero slope confirms interfacial slip, allowing operators to subtract slip velocity components from apparent flow rates.
Coating capillary interior surfaces with controlled micro-roughness or changing die construction materials modifies wall adhesion dynamics, delaying slip onset to higher shear stress limits.
A structured approach guarantees consistent evaluation of non-Newtonian flow behavior and interfacial slip dynamics during receiving inspection:
- Load degassed matrix resin charge into preheated capillary barrel and allow exact ten-minute thermal equilibration cycle.
- Perform low-shear baseline extrusion at fifty reciprocal seconds to establish initial thermal and pressure equilibrium.
- Execute multi-step logarithmic velocity sweep across target shear rates from one hundred to five thousand reciprocal seconds.
- Record steady-state force values at each velocity step after pressure signals stabilize within zero point two percent variation.
- Calculate apparent wall shear stress and apparent shear rate values from calibrated load cell and piston velocity inputs.
- Derive Rabinowitsch-Mooney correction factors from logarithmic flow rate stress derivative slopes.
- Apply Bagley pressure corrections using historical multi-die calibration datasets acquired for the specific die geometry.
- Compare corrected true shear viscosity flow curves against standard lot acceptance criteria.
Uncorrected wall slip in high-temperature thermoplastic prepreg testing leads to underestimating true resin viscosity by as much as twenty-eight percent. Standard procurement contracts specify that matrix viscosity curves must be derived using Rabinowitsch-Mooney corrected true shear rates with mandatory wall slip screening per ASTM D3835 Clause 8.3. Including explicit standard clauses prevents compliance verification based on uncorrected apparent viscosity figures recorded during transient wall slip regimes.
Matrix resin lots failing true shear viscosity targets are rejected prior to slitting and tape spooling operations, avoiding downstream component scrap.


Batch
Lot-to-lot consistency in prepreg manufacturing relies on tight control over resin formulation chemistry, B-stage advancement levels, and volatile organic content. Capillary rheometry acts as a clear receiving inspection boundary, catching subtle matrix anomalies before rolls are released into automated production lines. Ambient storage thermal excursions during prepreg transit alter B-stage thermoset advance levels, shifting minimum viscosity values and cure kinetic windows.
Testing matrix resin samples extracted from roll edge trimmings identifies thermal degradation, verifying that out-life consumption remains within design limits.
Resin advancement shifts the minimum viscosity region toward higher temperatures while reducing the operational time window available for composite consolidation. Oscillatory rheometry captures low-shear viscoelastic gelation points, yet fails to predict high-pressure shear flow required during resin squeeze-flow out of carbon fiber beds. Capillary testing evaluates high-shear flow response under compressive stresses that mirror actual autoclave processing pressures.
Deviations in minimum shear viscosity exceeding ten percent from baseline reference curves indicate improper resin stoichiometry, catalyst degradation, or thermal exposure during transport.

Can Capillary Rheometry Detect B-Stage Resin Aging?
Tracking B-stage advancement via capillary testing requires controlled thermal ramping profiles within the rheometer barrel prior to extrusion execution. Thermoset epoxy prepregs age continuously at room temperature, gradually consuming reactive epoxide groups and extending polymer network branch lengths. Higher molecular weight pre-polymers present elevated baseline shear viscosity across all shear rates, shifting flow curves upward relative to fresh production reference lots.
Exposing matrix samples to dynamic thermal ramps inside capillary barrels pinpoints the precise temperature of minimum viscosity during cure progression.
Comparative testing of fresh prepreg lots against samples aged intentionally for fourteen days at room temperature demonstrates measurable shear viscosity increases. High shear rate viscosity recorded at one hundred twenty degrees Celsius rises predictably with ambient exposure time, providing a quantitative metric for remaining out-life. Automated quality management systems compare measured batch shear profiles against historical aging matrices to estimate remaining usable room-temperature out-life.
Prepreg rolls exceeding maximum allowable viscosity thresholds are flagged automatically for immediate disposal or non-structural application downgrade.
The following failure modes illustrate key matrix anomalies detected through standardized capillary testing during receiving inspection:
- Accelerated Thermal Advancement occurs when ambient transit temperatures exceed storage limits, increasing baseline shear viscosity and narrowing the composite consolidation time window during cure cycles.
- Catalyst Stoichiometry Phase Separation arises from improper resin mixing, causing localized gelation micro-domains that trigger erratic high-shear pressure fluctuations inside capillary dies.
- Volatile Entrapment Instability develops when residual solvent or absorbed moisture vaporizes inside heated barrels, producing high-frequency pressure oscillations and void-riddled extrudate strands.
- Particulate Filler Agglomeration manifests when core-shell rubber tougheners clump, causing localized capillary orifice restriction and artificial viscosity spikes during extrusion sweeps.
- Reactive Diluent Volatilization occurs when low-molecular-weight reactive components boil off during preheating, altering matrix shear-thinning slopes and shifting power-law indices.
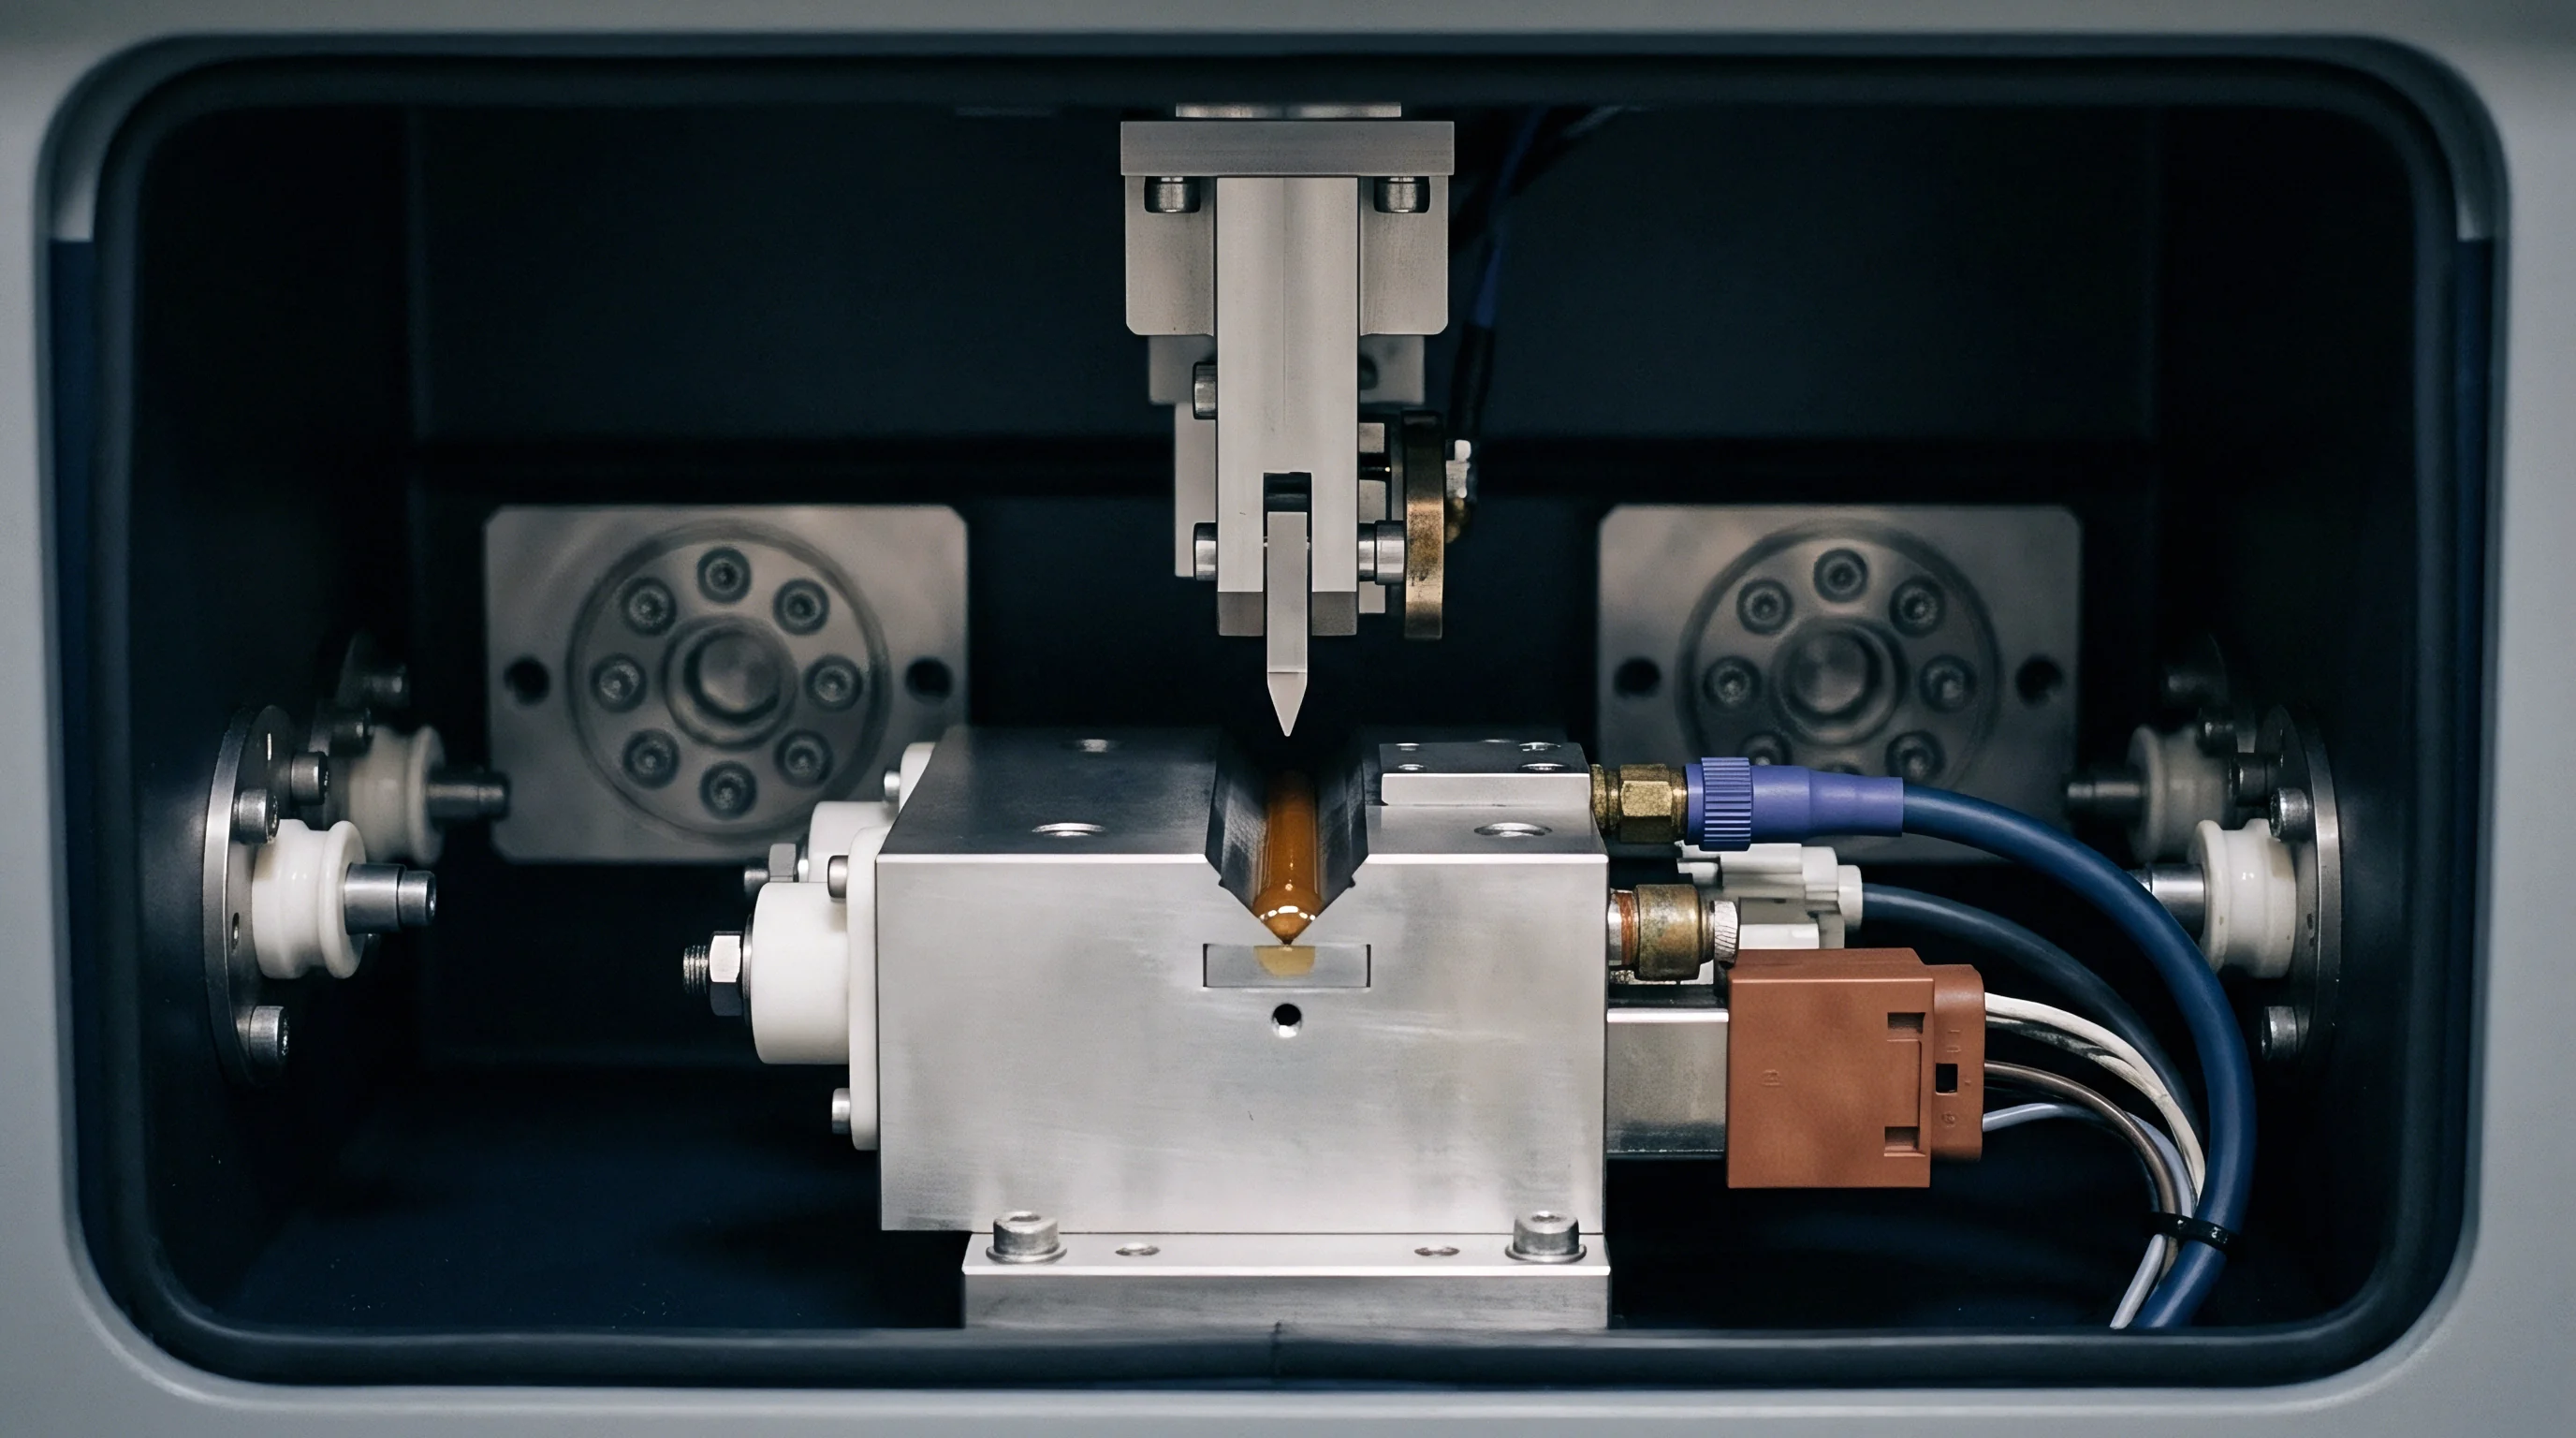
Thermoset Advancement Windows and Minimum Viscosity Shifts
Minimum matrix viscosity governs resin flow through fiber reinforcement beds during composite cure cycles, dictating final consolidation density and void content. Capillary testing protocols measure minimum viscosity by heating matrix charges at fixed rates matching production autoclave cure cycles while extruding at constant shear stress. The temperature at which minimum viscosity occurs shifts upward as resin advancement progresses, indicating loss of resin mobility at lower processing temperatures.
Higher minimum viscosity limits restrict resin flow, causing incomplete void elimination and dry fiber patch defects in thick structural laminates.
Correlations between capillary minimum viscosity measurements and composite laminate porosity levels validate receiving quality control thresholds. Laminates fabricated from prepreg batches exhibiting matrix shear viscosity twenty percent above baseline targets show three-fold increases in ultrasonic attenuation void indicators. Capillary testing identifies out-of-spec advancement far earlier than functional composite panel fabrication and destructive burn-off testing.
Automated roll screening using capillary rheometry cuts laboratory turn-around time from days to under two hours per incoming material lot.
Minimum viscosity shifts exceeding fifteen percent relative to qualified master curves correlate directly with elevated void content in autoclaved laminates.
Resin formulations containing volatile components or micro-moisture generate steam bubbles inside heated barrels, generating erratic pressure drop signals during extrusion. Installing back-pressure devices at capillary die exits suppresses bubble formation, isolating true matrix fluid viscosity from gas phase interference. Comparing back-pressurized flow curves against atmospheric exit runs quantifies volatile gas generation rates under processing conditions.
Material lots exhibiting severe volatile pressure drops undergo additional vacuum degassing steps before release to production floors.

Out Life Tracking across Receiving Inspection Lots
Out-life management protocols dictate strict cumulative room-temperature exposure limits for all structural thermoset prepregs used in aerospace primary structures. Shop floor exposure logs track elapsed time, yet fail to capture localized temperature spikes occurring during material transfer between freezer units and cutting tables. Capillary shear viscosity testing provides an absolute physical measurement of cumulative thermal exposure independent of administrative tracking records.
Direct testing of incoming roll leader samples verifies true chemical state before committing high-value carbon fiber webs to automated tape laying heads.
Developing master advancement curves requires measuring capillary shear viscosity across controlled room-temperature exposure intervals for each qualified prepreg resin system. Standardized quality control software matches lot viscosity data against master advancement curves to calculate equivalent room-temperature exposure days automatically. Prepreg rolls exposed to unauthorized thermal excursions during shipping present distinct shear-thinning slope changes that trigger immediate receiving hold status.
Quantifying thermal damage through physical shear testing prevents premature scrap of viable material rolls while blocking degraded lots from structural assembly.
When a prepreg shipment experienced a forty-eight-hour refrigeration failure during transoceanic transit, exposure logs were left ambiguous. Capillary rheometry testing on matrix samples extracted from three roll cores revealed a twenty-four percent shift in minimum shear viscosity relative to pristine reference standards. The physical reading provided indisputable proof of thermal advancement, forcing the logistics carrier to absorb the financial loss of the compromised shipment.
What unresolved chemical interactions occur when core-shell rubber tougheners interact with advancing epoxy networks under high shear rates inside narrow capillary channels?


Dossier
Quality control dossiers compile rheology test records, thermal history files, and raw pressure transducer logs into certified lot documentation packages. Digital dossiers accompany composite prepreg shipments, providing aerospace originators with verifiable proof of material compliance before manufacturing begins. Procurement specifications define exact capillary testing protocols, geometric die requirements, and statistical acceptance windows for all matrix viscosity parameters.
Traceability standards require linking capillary rheometer serial numbers, calibration logbooks, and die geometry wear logs directly to individual prepreg roll batch numbers.
Disagreements between raw test data and certified material performance sheets often stem from inconsistent sample extraction methodologies used by material vendors. Solvent extraction techniques can leave residual organic solvents that artificially depress matrix shear viscosity, while thermal melt-squeeze extraction methods risk advancing thermoset resins prior to testing. Standardized procurement dossier standards mandate fully validated extraction procedures using approved non-reactive solvents followed by vacuum drying cycles monitored via thermal gravimetric analysis.
Harmonizing sample preparation across material suppliers and receiving laboratories eliminates inter-laboratory measurement variance.
| Quality Control Stage | Testing Method | Direct Cost per Batch ($) | Defect Interception Rate (%) | Avoided Scrap Cost per Roll ($) |
|---|---|---|---|---|
| Receiving Roll Leader Screening | Single-Point Capillary Extrusion | 180.00 | 68.5 | 4,500.00 |
| Full Lot Qualification Dossier | Multi-Die Bagley & Rabinowitsch | 620.00 | 94.2 | 12,800.00 |
| Out-Life Expiration Audit | Temperature Ramp Capillary Sweep | 240.00 | 88.0 | 6,200.00 |
| Post-Process Scrap Root Cause | Full Slit-Die Viscous Heating Sweep | 1,150.00 | 99.1 | 45,000.00 (Part Loss) |

Standard Specification Parameters for Composite Procurement
Procurement specifications for structural composite prepregs establish rigid numerical windows for true shear viscosity across defined shear rate bands. Materials targeting automated fiber placement applications specify minimum shear viscosity limits at five thousand reciprocal seconds to ensure proper tape compaction without resin squeeze-out. Autoclave molding specifications focus on low-to-medium shear rate windows paired with minimum viscosity thermal ramp profiles to ensure proper void evacuation before resin gelation.
Quality engineering teams write these numerical limits directly into binding supply agreements, making lot acceptance contingent on capillary rheometer compliance.
Statistical process control metrics track lot-to-lot viscosity moving averages, identifying subtle formulation shifts before matrix parameters drift outside specification boundaries. Process capability indices calculated from historical capillary test data must exceed one point three three for qualified prepreg manufacturing facilities. When supplier capability indices drop below threshold levels, receiving inspection rules escalate automatically from periodic lot auditing to one hundred percent roll leader verification.
Quality dossiers flag statistical trend deviations, prompting joint engineering reviews between material producers and composite fabricators.
Evaluating prepreg quality dossiers requires systematic verification of testing documentation and instrument calibration records:
- Capillary Die Geometry Verification confirms that die diameter, length-to-diameter ratio, and entry angle match standard test method parameters within stated micrometric tolerances.
- Transducer Calibration Records validate that strain gauge pressure sensors undergo multi-point calibration against deadweight testers every six months.
- Solvent Residue Certification verifies that extracted matrix resin samples contain less than fifty parts per million residual solvent prior to barrel loading.
- Temperature Field Uniformity Logs demonstrate that heating zones along the capillary barrel maintain spatial uniformity within zero point one degree Celsius.
- Rabinowitsch-Mooney Correction Documentation guarantees that reported shear rate values represent true wall shear rates rather than uncorrected apparent metrics.

Rejection Tolerances for out of Spec Resin Batches
Material rejection protocols trigger automatically when incoming prepreg roll samples fail designated capillary shear viscosity limits. Standard supply agreements grant material buyers full credit or immediate replacement for prepreg lots failing validated receiving inspection tests. Rejection reports incorporate raw pressure transducer traces, die geometry calibration files, and multi-die Bagley correction plots to eliminate vendor disputes.
Providing fully documented rheological test dossiers forces material suppliers to accept returned rolls without costly third-party arbitration delays.
Dispute resolution clauses in international composite procurement contracts specify reference testing laboratories equipped with standardized capillary rheometer setups. When buyer and vendor testing results conflict, reference laboratories execute standardized multi-die extrusion sweeps using identical resin extraction protocols. The reference laboratory’s Bagley and Rabinowitsch-Mooney corrected flow curves serve as binding legal determinations for lot acceptance or rejection.
Establishing unambiguous capillary testing protocols in initial contract terms minimizes legal exposure and protects composite manufacturing schedules.
Incorporating mandatory multi-die entrance loss corrections into procurement contract clauses prevents material vendors from contesting lot rejection actions.
Scrap costs associated with molding structural composite components from out-of-spec prepreg far outweigh receiving inspection expenses. A single wing skin panel scrapped due to matrix void content caused by un-advanced high-viscosity resin can cost hundreds of thousands of dollars in lost materials and autoclave time. Investing in standardized capillary rheometry QC testing at receiving docks provides an immediate return by intercepting defective material rolls before lay-up operations begin.
Material tracking software seals digital dossiers into permanent quality records linked to finished aircraft tail numbers.

Cost Allocation for Composite Defect Root Cause Identification
Post-failure investigations of scrapped composite components rely on historical quality dossiers to isolate material defect causes from processing anomalies. When structural panels exhibit localized micro-cracking or improper resin-fiber ratios, quality engineers cross-reference cure log data against incoming roll rheology records. Access to true shear viscosity curves collected across high shear rates clarifies whether resin flow deficits caused dry fiber areas during molding.
Isolating material deficiency from tool thermal imbalance allows factory managers to assign financial liability accurately between prepreg vendors and autoclave operators.
Capital expenditure commitments for capillary rheometry testing equipment payback within twelve months through reduced factory scrap rates and avoided supplier dispute costs. High-pressure capillary rheometers fitted with precision twin-barrel assemblies enable simultaneous long-die and short-die extrusions, cutting test execution durations in half. Modern automated cleaning accessories decrease operator handling time, increasing daily sample throughput across busy manufacturing receiving docks.
Quality management teams leverage robust capillary rheology data to maintain lean prepreg inventories without increasing scrap risks during production runs.
Capillary rheometry quality control testing converts prepreg flow claims into objective, physical viscosity parameters that protect structural composite manufacturing. Matrix viscosity verified under actual processing shear rates prevents costly shop floor rejections.