Field Inspection Procedures for Automated Gas Pipeline Shutoff Valve Verification
Field verification of automated gas pipeline shutoff valves requires dynamic differential breakout torque logging, acoustic leak checks, and SIL trip timing.


Actuator
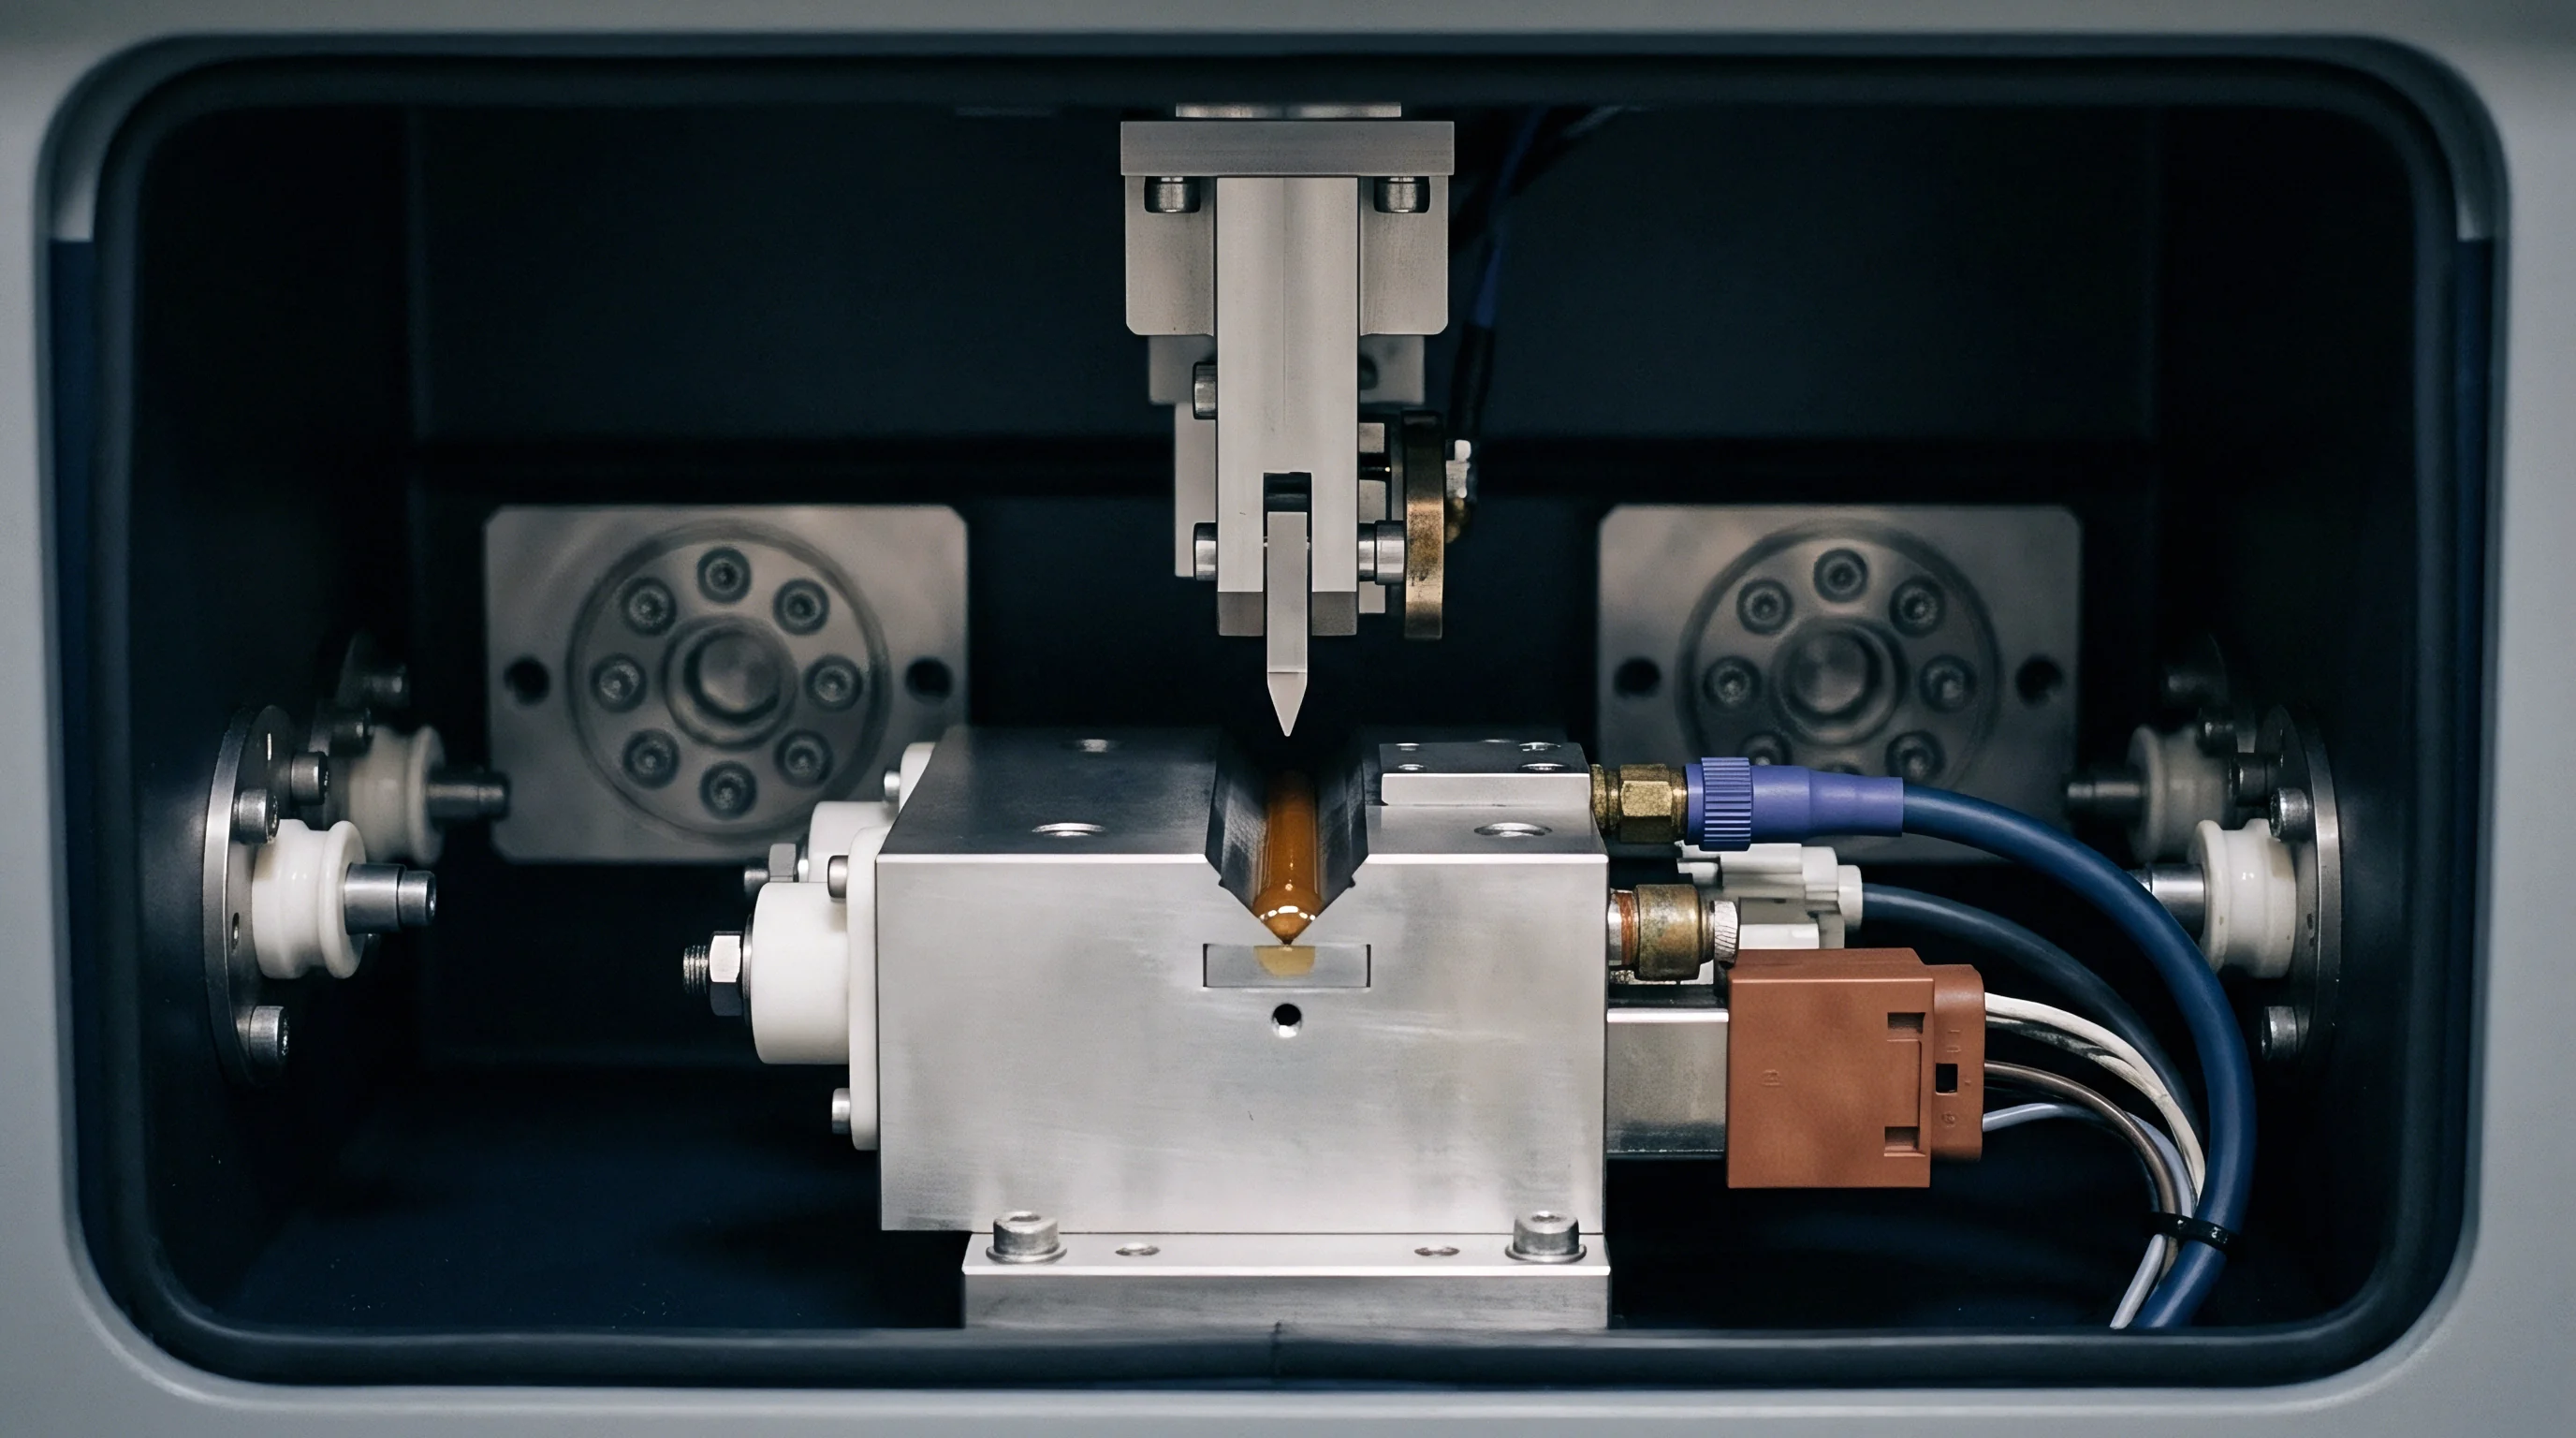
Mechanical Power Delivery and Torque Margin Profiling
Field verification of automated gas pipeline shutoff valves starts at the mechanical drive interface, where pneumatic cylinder pressure, gas-over-oil hydraulic thrust, or electric motor gear trains convert control energy into stem displacement. Standard commissioning protocols often test valve travel under zero static line pressure, missing the friction spikes that occur when natural gas differential forces pin ball or gate sealing elements against downstream seats. Across high-pressure transmission networks, dry gas, debris accumulation, and long static dwell routinely drive breakout torque requirements 40 percent to 80 percent above factory baseline curves.
Field inspections verify that motor drive output delivers sufficient mechanical force through the entire operating arc. For pneumatic supply systems, technicians log a supply pressure baseline prior to dynamic testing, tracking static vessel pressure against transient line drops during rapid stroke initiation. If supply pressure falls more than 15 percent below nominal rating at stroke launch, quick-exhaust port restrictions or undersized supply lines are typically choking dynamic torque output.
Technicians connect calibrated pressure transducers to both cylinder chambers to capture differential pressure traces across partial and full stroke movements, mapping how mechanical energy is actually delivered.
Hydraulic gas-over-oil power units require fluid level checks, gas supply regulator pressure verification, and oil contamination sampling. Accumulator pre-charge pressures decay over thermal cycles, eroding the reserve energy needed for full valve closure during an emergency trip. Inspectors check nitrogen pre-charge levels with external pressure gauge manifolds, isolating accumulator bottles from line pressure before taking a static reading.
Fluid analysis during routine maintenance screens for particulates and water emulsion, both of which can bind internal spool valves inside control manifolds.

Partial Stroke Diagnostics and Dynamic Resistance
Automated partial stroke testing lets operators confirm valve stem mobility and actuator mechanical integrity without interrupting gas transmission. The test commands the drive to move between 5 percent and 15 percent of full stroke displacement before returning to fully open. High-resolution position sensors paired with pneumatic cylinder pressure transducers generate diagnostic signatures that catch stem binding, packing friction, and internal mechanical slop.
Dynamic torque traces recorded during partial stroke testing establish a baseline for tracking mechanical health over time. Deviations from that baseline point to specific physical wear inside the drive stack, valve stem packing gland, or internal seating components. Evaluating the pressure differential across the driving piston during movement isolates pneumatic friction from mechanical resistance originating within the valve body.
Field partial stroke testing at 100 bar line pressure identified stem packing friction increases of 34 percent after six months of static open dwell.
Field verification workflows require technicians to review baseline calibration data before running automated diagnostics. Diagnostic software executing partial stroke sequences measures total trip initiation time, peak break-open pressure, dynamic travel pressure, and stroke return overshoot. Comparing these values against benchmark curves recorded during site acceptance testing exposes internal mechanical degradation before catastrophic drive failure occurs.
- Breakout Torque Drift Higher friction from stem packing consolidation or seat swelling requires greater initial pressure to start stem movement, extending trip initiation latency.
- Piston Seal Bypass Internal air leakage past pneumatic cylinder piston seals lowers dynamic differential pressure, resulting in sluggish mid-stroke travel and irregular position transmitter curves.
- Mechanical Backlash Excessive play between the drive output yoke and valve stem coupling creates stepped position transmitter profiles during stroke reversal.
- Control Solenoid Vent Restriction Particulate buildup or ice inside solenoid exhaust orifices restricts venting speed, slowing mechanical response during safety trips.
Wet gas testing produced false-positive stroke confirmations when magnetic position switches were set without thermal expansion offsets. Setting magnetic limit switches under cold ambient conditions without accounting for pipeline thermal growth causes false trip signals when line temperatures rise during high-flow summer operations. Field inspectors verify switch trigger points across extreme seasonal temperature swings to guarantee signal repeatability under all operating environments.
Linear position transducers mounted on valve yokes supply continuous stem displacement feedback during diagnostic runs. Mechanical play within feedback linkage arms distorts position curves and masks actual stem motion. Technicians run manual dial indicator checks against transducer output to verify position feedback precision within 0.5 percent of full stroke length.


Differential

Breakout Torque Metrics under Line Pressure
Evaluating automated shutoff valve integrity demands precise measurement of breakout torque under full differential line pressure conditions. Natural gas transmission pipelines operating between 50 bar and 120 bar exert heavy hydrostatic thrust against upstream ball or gate faces. This static thrust presses seating surfaces together, multiplying friction coefficients across metal or soft seats.
Sizing calculations relying exclusively on unpressurized bench tests fail in real field operating environments.
Field inspection procedures mandate differential pressure verification by closing bypass valves and establishing full operating pressure differential across closed or partially stroke-tested valve elements. Technicians measure pneumatic or hydraulic cylinder pressure right as stem rotation or sliding begins. Converting cylinder differential pressure into torque output using verified actuator geometry yields the actual breakout torque required under real line conditions.
| Nominal Bore (Inches) | ANSI Class Rating | Differential Pressure (bar) | Bench Torque Baseline (Nm) | Field Breakout Torque (Nm) | Observed Torque Multiplication |
|---|---|---|---|---|---|
| 8 | 600 | 70 | 450 | 780 | 1.73x |
| 12 | 600 | 70 | 1,200 | 2,150 | 1.79x |
| 16 | 900 | 100 | 3,100 | 5,890 | 1.90x |
| 24 | 900 | 100 | 8,500 | 16,830 | 1.98x |
| 30 | 1500 | 150 | 18,200 | 38,220 | 2.10x |
| 36 | 1500 | 150 | 29,000 | 63,800 | 2.20x |
Differential torque calculations provided by valve manufacturers routinely assume clean, dry natural gas rather than dirty field gas carrying compressor oil carryover. Fine particulates suspended in raw pipeline gas settle inside seat cavity recesses, creating abrasive sludge that resists ball movement. Field verification procedures incorporate safety factor checks, confirming that available actuator output exceeds measured differential breakout torque by a minimum safety factor of 1.5 under worst-case operating gas pressures.
Available drive output torque under minimum instrument gas pressure must exceed peak measured breakout torque by 50 percent to guarantee fail-safe stroke completion.
Running torque measurements capture mechanical resistance through the middle of the stroke path. Differential pressure forces drop slightly as the ball rotates toward the open position, but gas velocity through the expanding orifice introduces dynamic aerodynamic torque vectors. Inspectors log continuous hydraulic or pneumatic pressure profiles during full opening and closing cycles to catch any torque peaks occurring mid-stroke.

Hydraulic and Pneumatic Pressure Decay Tracking
Pressure decay tracking isolates drive power delivery degradation from mechanical seating issues. When inspecting pneumatic scotch-yoke drives, technicians pressurize the power cylinder to maximum operating pressure, isolate the supply line using high-integrity ball valves, and monitor cylinder pressure decay over a thirty-minute test window. Pressure drops exceeding 0.1 bar over thirty minutes point to piston seal degradation, rod packing leakage, or manifold block port flaws.
Monitoring pressure drop curves across test intervals separates static seal failures from dynamic seal wear occurring during travel. Dual-chamber differential logging exposes internal bypass leakage between power stroke chambers, which deprives the drive of necessary pressure differentials during emergency shutdowns.
While field breakout torque spikes are often attributed strictly to line particulate contamination rather than sizing calculations, teardowns and diagnostic torque traces show that seat spring degradation and thermal expansion mismatches between valve bodies and internal trims account for over half of observed spikes.


Seat

Acoustic Emission and Bubble Count Testing
Internal seat tightness verification ensures complete gas isolation when an automated valve receives a trip command. Gas leaking past closed valve seats in high-pressure transmission lines wastes product and creates severe safety hazards downstream. Conventional field checks rely on downstream vent valve monitoring, but vent line backpressure and manifold volume delays make small leaks hard to detect.
Acoustic emission sensors offer immediate, non-intrusive detection by measuring high-frequency ultrasonic energy generated by turbulent gas flow across seat seal faces.
Acoustic sensors mounted directly on the valve body upstream and downstream of the seat ring detect ultrasonic signals in the 20 kHz to 100 kHz range. Turbulent gas escaping through micro-gaps between ball and seat produces localized acoustic energy proportional to mass leak rate and differential pressure. Inspectors calibrate acoustic baseline readings against background noise from upstream piping flow to isolate true seat leakage signals from structural acoustic noise.
| Detection Instrument Method | Minimum Detectable Leak Rate | Measurement Range | Ambient Noise Sensitivity | Required Field Test Duration |
|---|---|---|---|---|
| Acoustic Emission Ultrasonic Array | 0.05 Standard Liters/Min | 0.05 – 50.0 SLPM | Low (High-pass filtered above 30 kHz) | 5 Minutes |
| Thermal Mass Flow Meter | 0.01 Standard Liters/Min | 0.01 – 100.0 SLPM | Negligible | 15 Minutes |
| Differential Pressure Decay Logging | 0.10 Standard Liters/Min | 0.10 – 20.0 SLPM | High (Requires thermal stabilization) | 30 Minutes |
| Direct Displacement Bubble Counter | 0.001 Standard Liters/Min | 0.001 – 1.0 SLPM | Negligible | 20 Minutes |
| Methods calibrated at 70 bar differential line pressure using pipeline quality natural gas under thermally stable conditions. | ||||
Direct volumetric measurement using calibrated bubble counting apparatus or precision thermal mass flow meters mounted on cavity vent ports remains the gold standard for quantitative leak rate verification. Field procedures require cavity depressurization following valve closure, letting technicians measure volumetric gas flow escaping past the upstream seat seal into the body cavity.
Low-pressure nitrogen bubble tests performed on site confirm resilient soft-seat integrity before introducing high-pressure hydrocarbon gas. Technicians connect a portable nitrogen manifold to the body bleed connection, pressurize the cavity to 6 bar, and capture vent discharge in an inverted, water-filled graduated cylinder. Comparing measured bubble frequencies against standard conversion tables provides exact mass leakage rates.
ISO 5208 Rate A specification permits zero visually detectable leakage during high-pressure hydrostatic seat testing, whereas Rate D permits up to 0.1 cubic millimeters per second per millimeter of nominal valve size for gas applications.

Field Seat Leakage Inspection Execution
Accurate seat leakage verification requires tight control over body cavity venting and line differential pressures. Technicians follow a standard sequence to isolate upstream and downstream sealing faces independently.
- Command the automated valve to the fully closed position, logging electronic position feedback to confirm 100 percent closure.
- Isolate the valve body cavity by closing manual body bleed equalization valves and vent line bypasses.
- Open the lower body cavity bleed valve slowly, discharging trapped gas into a safe vent system until cavity pressure drops to atmospheric level.
- Connect a calibrated thermal mass flow meter or acoustic emission sensor array to the open body bleed connection.
- Monitor body cavity pressure for fifteen minutes with the vent closed to check for static pressure buildup indicating seat bypass flow.
- Record volumetric leakage rate under full pipeline differential pressure, comparing results against maximum allowable leakage limits defined in API 598.
- Flush seat injection ports with synthetic valve cleaner if leakage exceeds allowable rates, followed by high-viscosity seal grease injection to re-test seat sealing capability.
Procurement contracts incorporating API 6D Annex B supplemental requirements mandate that field seat tightness tests achieve zero bubble leakage across soft seats at 1.1 times maximum operating pressure differential. Standard commercial supply agreements often rely on less stringent ISO 5208 Rate D leakage allowances, permitting measurable gas bypass that accumulates inside closed pipeline sections during extended maintenance shutdowns.
Emergency seal injection procedures provide temporary sealing when particulate scoring damages primary elastomer seat rings. High-pressure grease guns inject synthetic sealants through body check valves directly into seat ring channels, filling micro-scratches on polished ball surfaces to achieve temporary bubble-tight shutoff during emergency operations.


Telemetry

Position Transmitter Linearity and Limit Switch Verification
Automated pipeline shutoff valves rely on digital and analog telemetry interfaces to transmit position status back to regional SCADA control centers. Electronic position transmitters output continuously variable 4-20 mA current loops corresponding to zero percent open through 100 percent fully open travel. Field verification protocols check transmitter linearity across five calibrated points: 0, 25, 50, 75, and 100 percent stroke displacement.
Technicians attach precision digital calipers or dial gauges to the mechanical stem indicator, stepping the valve manually or pneumatically through full travel increments. Measuring current loop output at each step confirms whether transmitter output stays within 0.25 percent of actual physical position. Nonlinearity points to loose mounting brackets, worn drive gears inside positioner housings, or sensor drift caused by ambient temperature changes.

What Latency Thresholds Cause SCADA Trip Rejections?
Safety instrumented systems enforce strict time windows for position state transitions following an emergency trip command. Control algorithms flag an automated shutoff valve as faulted if position feedback signals fail to register complete closure within pre-configured time frames. Response time tests measure total elapsed time from solenoid de-energization to auxiliary limit switch contact activation.
Total position signal latency reflects electrical relay delays, solenoid air exhaust time, mechanical break-open initiation, dynamic travel duration, and limit switch contact bounce. Signal delays exceeding 50 milliseconds inside safety logic solvers trigger alarms that block automated pipeline restart sequences.
Telemetry delays often trace back to unshielded signal cabling running adjacent to variable frequency drives in compressor stations. High-voltage electromagnetic interference induces transient voltage spikes on 24 VDC switch circuits, causing false trip status changes or flickering position signals at SCADA master stations. Installing twisted-pair shielded signal wiring grounded at a single instrument earth point eliminates induced voltage noise.
Field inspectors apply continuous loop monitoring during partial stroke tests to confirm positioner HART protocol variables transmit accurate diagnostic alerts. Advanced positioners record travel hysteresis, stroke speed variance, and drive air pressure profiles. Technicians download these diagnostic logs during field visits, analyzing trend lines for early indicators of mechanical spring fatigue or pilot valve fouling.
Field telemetry verification protocols require systematic validation of electronic and mechanical position feedback hardware.
- Limit Switch Contact Resistance Check switch terminal contact resistance using a digital micro-ohmmeter to ensure clean contact closure under low-voltage signal conditions.
- 4-20 mA Signal Loop Impedance Verify total signal loop resistance to confirm remote SCADA analog input cards operate within specified voltage supply limits without signal clipping.
- Emergency Trip Override Interlocks Test local manual override switches to confirm field ESD commands immediately bypass automatic SCADA controls and trigger instant valve isolation.
- HART Diagnostic Alert Mapping Verify internal positioner fault codes, including low air supply pressure and stroke time exceedance, correctly trigger priority alarms at the main control board.
Technicians encounter persistent calibration drift when inductive proximity switches are mounted on flexible bracket assemblies attached to high-vibration compressor discharge lines. Vibration-induced bracket flex alters switch gap distances, causing intermittent loss of closed-position signals during peak gas throughput periods.
Unresolved questions remain regarding how wireless telemetry gateways handle continuous high-frequency position diagnostic data streams during severe solar weather events. Solar storms and high ionospheric activity intermittently disrupt satellite and radio bandwidth, introducing variable latency into real-time valve verification polling protocols across remote wilderness pipeline segments.


Interlock

Fail-Safe Spring Return Mechanics and Solenoid Execution
Safety instrumented functions rely on fail-safe spring return mechanisms within pneumatic and hydraulic actuators to close automated shutoff valves when power or control signals fail. Spring-return scotch-yoke actuators use heavy compressed helical springs housed in sealed steel cylinders. When trip solenoids vent pneumatic pressure from the main power piston, stored spring energy drives the mechanical yoke, forcing the valve stem closed.
Field inspections test fail-safe spring mechanics under full load conditions. Technicians simulate emergency shutdown conditions by de-energizing control solenoid circuits, measuring the exact time required for the spring package to drive the valve from 100 percent open to 100 percent closed. Spring force decays with temperature and age, while internal spring corrosion can lead to mechanical binding or slower closure speed.
| Execution Sequence Sub-System | Design Allocated Time Budget (s) | Measured Field Response (s) | Observed Performance Variance | Primary Mechanical Bottleneck |
|---|---|---|---|---|
| Safety Logic Solver Relay Trip Signal | 0.050 | 0.045 | -10.0% | Electrical Relay Switching Time |
| Solenoid Valve De-Energization & Venting | 0.250 | 0.380 | +52.0% | Pilot Orifice Pneumatic Backpressure |
| Quick-Exhaust Valve Air Discharge | 0.500 | 0.720 | +44.0% | Exhaust Silencer Particulate Restriction |
| Mechanical Breakout & Piston Acceleration | 1.000 | 1.450 | +45.0% | Static Stem Packing & Seat Friction |
| Dynamic Stroke Travel to Fully Closed | 4.000 | 4.200 | +5.0% | Cylinder Piston Seal Drag |
| Auxiliary Limit Switch Signal Confirmation | 0.100 | 0.095 | -5.0% | Mechanical Target Switch Gap |
Pneumatic exhaust capacity directly controls fail-safe closing speed. Quick-exhaust valves mounted directly on actuator cylinder ports dump trapped air into the atmosphere, bypassing narrow solenoid tubing. Inspectors examine quick-exhaust valve bug screens and silencers for dirt accumulation, insect nests, or ice buildup caused by rapid gas expansion during venting, any of which restrict exhaust flow and delay closure.
In cold ambient environments, trace moisture in supply gas freezes inside quick-exhaust orifices during rapid venting, jamming exhaust poppets mid-stroke. Installing moisture separators and desiccant air dryers upstream of instrument gas supply headers prevents ice formation inside trip control circuits.
Dual redundant 3-way solenoid valves configured in 1oo2 or 2oo2 voting arrangements guarantee fail-safe trips while preventing spurious shutdowns caused by single-coil electrical failures.

Safety Instrumented Function Verification Dossiers
Functional safety verification protocols under IEC 61511 require complete documentation of field interlock testing to validate Safety Integrity Level (SIL) ratings. Inspectors compile dossiers containing trip timing traces, partial stroke test logs, solenoid valve power consumption records, and manual override position checks. This documentation proves automated shutoff valves fulfill risk reduction requirements established in pipeline hazard safety assessments.
Field checks verify mechanical interlocks and lock-out tag-out assemblies designed to prevent unauthorized manual bypass of safety functions. Manual handwheel declutchable gear operators must stay disengaged during normal automated operation, with locking pins secured to prevent accidental interference with fail-safe spring movement.
- Functional Safety Certification Records Original factory SIL certificates defining Probability of Failure on Demand (PFD) and Safe Failure Fraction (SFF) ratings for the complete valve assembly.
- Field Trip Execution Time Records Calibrated timer traces showing total elapsed closing time from initial signal de-energization to final seat contact under line pressure.
- Instrument Gas Quality Verification Reports Dew point and oil content test records proving supply gas meets ISA 7.0.01 quality standards for instrument air and gas systems.
- Proof Test Execution Certificates Signed field compliance logs documenting full-stroke testing, acoustic seat leakage checks, and emergency manual override verification.
Field verification checks reveal that pneumatic control tubing runs exceeding ten meters between solenoid control cabinets and actuator cylinders introduce pneumatic signal transport delays that degrade total emergency closure speeds. Solenoid control blocks mounted directly onto the actuator yoke minimize line pressure drop and air transport latency during safety trips.
Spring force must always exceed seat friction at every point of stem travel to achieve fail-safe operation.


Dossier

Site Acceptance Testing and Regulatory Audit Trails
Field verification culminates in compiling the comprehensive site acceptance test dossier, establishing legal proof of regulatory compliance for pipeline regulatory authorities. Federal pipeline safety regulations enforce strict oversight of automated emergency shutoff valves installed on high-consequence natural gas transmission lines. Documentation packages must demonstrate that field-installed valve packages perform within design envelope limits established during original risk assessments.
Commissioning workflows verify automated shutoff valve packages by cross-referencing field stroke trace graphs against factory hydrostatic seat tightness records. Discrepancies between factory bench performance and site acceptance test results indicate mechanical damage incurred during shipping, improper field installation alignment, or site piping stress imparted onto valve bodies. Structural stress from unaligned pipe flanges distorts valve body bore geometry, causing internal ball binding and premature seat seal failure.
Field inspectors check flange alignment, bolt torque patterns, and pipe support structures prior to final site acceptance signoff. Using laser alignment tools, technicians verify that companion pipe flanges sit parallel within 0.5 degrees and concentric within 1.5 millimeters before tightening flange studs to specified torque values using calibrated hydraulic wrenches. Proper mechanical installation eliminates external piping stress, allowing valve internals to operate smoothly across their entire service life.

Baseline Data Logging and Asset Health Management
Baseline diagnostic signatures recorded during initial commissioning serve as the reference standard for all future predictive maintenance inspections. Field technicians archive high-frequency pressure traces, position feedback curves, breakout torque values, and acoustic emission leakage spectra within enterprise asset management databases. Advanced diagnostic software algorithms compare future routine test data against these baseline curves, automatically flagging subtle trends indicating wear, seal breakdown, or mechanical play.
Digital verification dossiers include detailed calibration certificates for all field test instruments used during inspection runs. Regulatory auditors reject compliance filings if test instruments lack traceable calibration credentials issued by accredited standards laboratories. Field personnel scan and attach instrument calibration certificates directly to electronic test execution logs, creating an unbroken chain of custody for all measured verification parameters.
Long-term reliability of automated pipeline shutoff valves depends on strict adherence to recurring field inspection schedules. Regulators mandate full-stroke operational testing and seat tightness verification at intervals not exceeding fifteen months or twice per calendar year. Structured field verification procedures ensure that emergency isolation assets remain fully operational, protecting personnel, surrounding communities, and pipeline infrastructure from catastrophic natural gas release events.