Mathematical Decay Modeling for Engineering Sample Conversion to Purchase Orders
Parametric Weibull hazard modeling converts aging engineering sample pipelines into accurate, time-discounted production demand forecasts.


Decay

Sample Dispatch Lead Depletion Dynamics
Engineering sample dispatches create an immediate, finite window of commercial relevance. When a physical evaluation unit arrives at an original equipment manufacturer testing facility, interest peaks during initial bench verification, followed by a steady drop in contact frequency. Quantitative evaluation tracking demonstrates that eighty percent of ultimate volume conversions initiate functional communication within forty-five calendar days of sample receipt.
An evaluation effort exceeding ninety days without an intermediate qualification sign-off yields purchase conversion rates under six percent. Engineers reassign bench hardware to secondary test racks as primary production schedules intervene.
Sample conversion tracking requires formal hazard rate modeling rather than static quarterly pipeline projections. The conditional probability that a prospective account issues a binding production purchase order at time t, given non-conversion prior to t, exhibits negative duration dependence. Physical component evaluation consumes technician hours, chamber capacity, and diagnostic bandwidth.
As days accrue without production scheduling, internal client momentum shifts toward incumbent hardware or alternate supplier designs. The decay parameter reflects both technical friction and competitor counter-sampling.
Evaluation accounts silent beyond forty-five calendar days convert to binding production agreements at rates below six percent.
Component suppliers frequently confuse evaluation receipt with active procurement interest. Field tracking across discrete semiconductor, passive component, and structural subsystem trials reveals that fifty-five percent of dispatched prototypes undergo initial testing within fourteen calendar days. Thirty percent linger in inbound receiving docks or corporate quarantine storage without electrical continuity checks.
Tracking the decay rate of sample conversion enables accurate factory loading, early obsolescence recognition, and disciplined sales resource allocation.
The time to production conversion follows an underlying continuous survival function, denoted S(t), paired with an associated hazard function, λ(t). Field observations across industrial hardware evaluations show that λ(t) is rarely constant. The initial qualification window displays a pronounced early crest, followed by an aggressive exponential drop.
Mathematical decay modeling establishes the statistical boundary where further engineering follow-up generates negative return on invested capital.
Standard commercial supply agreements incorporate explicit sample validation windows to bound this depreciation. Procurement departments operate on rigid approval cycles, binding design sign-off to fiscal quarter boundaries. When qualification testing drifts past scheduled gate reviews, budgetary allocations shift to parallel programs.


Hazard

Parametric Survival Models for Pipeline Attrition
Survival analysis models the duration from sample dispatch to the issuance of an initial production purchase order. The non-parametric Kaplan-Meier estimator provides an empirical baseline for conversion timing, while parametric hazard models yield predictive equations necessary for production planning. Standard linear decay models fail because they ignore right-censoring, where evaluation projects remain open at the close of an observation window without formal rejection.
The parametric hazard rate λ(t) defines the instantaneous velocity of conversion given that the account has remained uncommitted up to time t.
The Weibull distribution accommodates non-monotonic or strictly decreasing hazard profiles common to industrial hardware design cycles. The Weibull hazard function incorporates a scale parameter, α, and a shape parameter, β:
λ(t) = (β / α) (t / α)^(β – 1)
When the shape parameter satisfies β < 1, the process exhibits negative duration dependence. Each elapsed day without qualification acceptance diminishes the probability of subsequent conversion. In power module and microcontroller evaluations, empirical estimation yields β values between 0.62 and 0.78, confirming aggressive qualification decay.
The exponential distribution, which enforces a constant hazard rate where β = 1, proves invalid for engineering evaluations because memoryless assumptions contradict observed engineering bench fatigue.
| Component Category | Sample Size (Units) | Scale Parameter α (Days) | Shape Parameter β | Half-Life t_half (Days) | Mean Conversion Rate |
|---|---|---|---|---|---|
| Discrete Power Silicon | 420 | 64.2 | 0.71 | 38.4 | 0.28 |
| Custom Magnetic Assemblies | 185 | 82.6 | 0.64 | 46.1 | 0.19 |
| Industrial Microcontrollers | 610 | 112.4 | 0.74 | 71.5 | 0.34 |
| Precision RF Connectors | 340 | 48.1 | 0.68 | 27.3 | 0.41 |
| Optoelectronic Transceivers | 230 | 58.9 | 0.65 | 33.8 | 0.22 |
The log-logistic distribution serves as an alternative when conversion probability peaks slightly after delivery due to mandatory burn-in test protocols. If environmental screening requires a three-week dwell cycle, the empirical hazard rate rises during the initial twenty-one days before decaying rapidly. The log-logistic hazard function permits this initial positive slope followed by long-tail attrition:
λ(t) = /
Model selection between Weibull and log-logistic formulations relies on the Akaike Information Criterion evaluated against historical cohort logs. A cohort of four hundred connector samples showed a log-logistic specification minimized residual sum of squares by twelve percent compared to an exponential baseline. Incorporating right-censored data via partial likelihood estimation ensures that prolonged, non-responsive accounts do not artificially distort early conversion velocity.
Section 4.2 of standard industrial supply master terms cancels reserved volume allocations if prototype qualification sign-off lapses past sixty days.
Covariates modifying the baseline hazard function enter through the Cox proportional hazards framework:
λ(t | X) = λ_0(t) exp(γ_1 X_1 + γ_2 X_2 +. + γ_n X_n)
Regression coefficients reveal the commercial weight of technical variables. Providing fully assembled evaluation boards alongside raw components scales the baseline hazard by an exponential factor of 1.48. Conversely, custom pin configurations absent from secondary sourcing options depress the conversion hazard by a factor of 0.72 due to enterprise single-source avoidance policies.
The mathematical model captures commercial hesitation directly through covariate weighting.
Accelerating production conversions demands systematic reduction of qualification friction. Engineering departments operate under strict project milestones, meaning component delays instantly compromise overall device launch dates. When bench engineers encounter undocumented firmware flags or pinout ambiguities, testing ceases immediately.
Field test logs confirm that sixty-two percent of uncompleted evaluations stall due to unaddressed technical queries during the first seven days of board power-up.
A manufacturing team that leaves sample conversion to unstructured quarterly follow-up misallocates capital across dead pipeline volume while starving responsive design cycles of inventory backing.


Friction

Bench Impediments and Qualification Roadblocks
Conversion decay stems from physical and administrative friction points encountered inside client development facilities. When a hardware development team receives advanced engineering prototypes, the evaluation proceeds through rigid verification phases. Each phase introduces failure modes that terminate procurement progress without formal rejection notices reaching the component supplier.
- Thermal Dissipation Incompatibility emerges when peak junction temperatures exceed customer chassis cooling thresholds under continuous operational testing, instantly stopping qualification procedures.
- Firmware Toolchain Resistance develops when proprietary configuration software requires elevated operating system permissions or incompatible compiler toolchains, leading development teams to abandon evaluation in favor of familiar architectures.
- Form Factor Interference occurs when physical package tolerances, solder pad geometry, or connector clearances clash with dense peripheral assemblies on revisions of the host mainboard.
- Secondary Sourcing Deficits trigger corporate procurement vetoes when risk management protocols dictate that any critical bill-of-materials entry must feature an industry-standard second-source supplier available on ninety-day delivery windows.
- Price Tiering Misalignment invalidates months of technical bench testing when volume procurement pricing formulas reveal unbridgeable unit economics at high-rate factory production steps.
Understanding these friction points allows sales engineering desks to assign empirical weights to observed pipeline stagnation. An unreturned inquiry regarding register maps signifies technical stall, whereas delays regarding environmental certification documentation indicate standard corporate legal lag. Separating technical friction from procurement protocol permits precise adjustment of the decay parameter in active pipeline forecasts.
Client design personnel rarely announce test terminations. Silence remains the default operational outcome for unsuccessful component sampling. The supplier misinterprets this absence of negative communication as ongoing evaluation, carrying zero-probability conversion prospects on financial ledgers for multiple quarters.
A rule of thumb holds that an unresponsive design lead requires half the time to fully abandon a component as it took to request the initial sample.


Drift
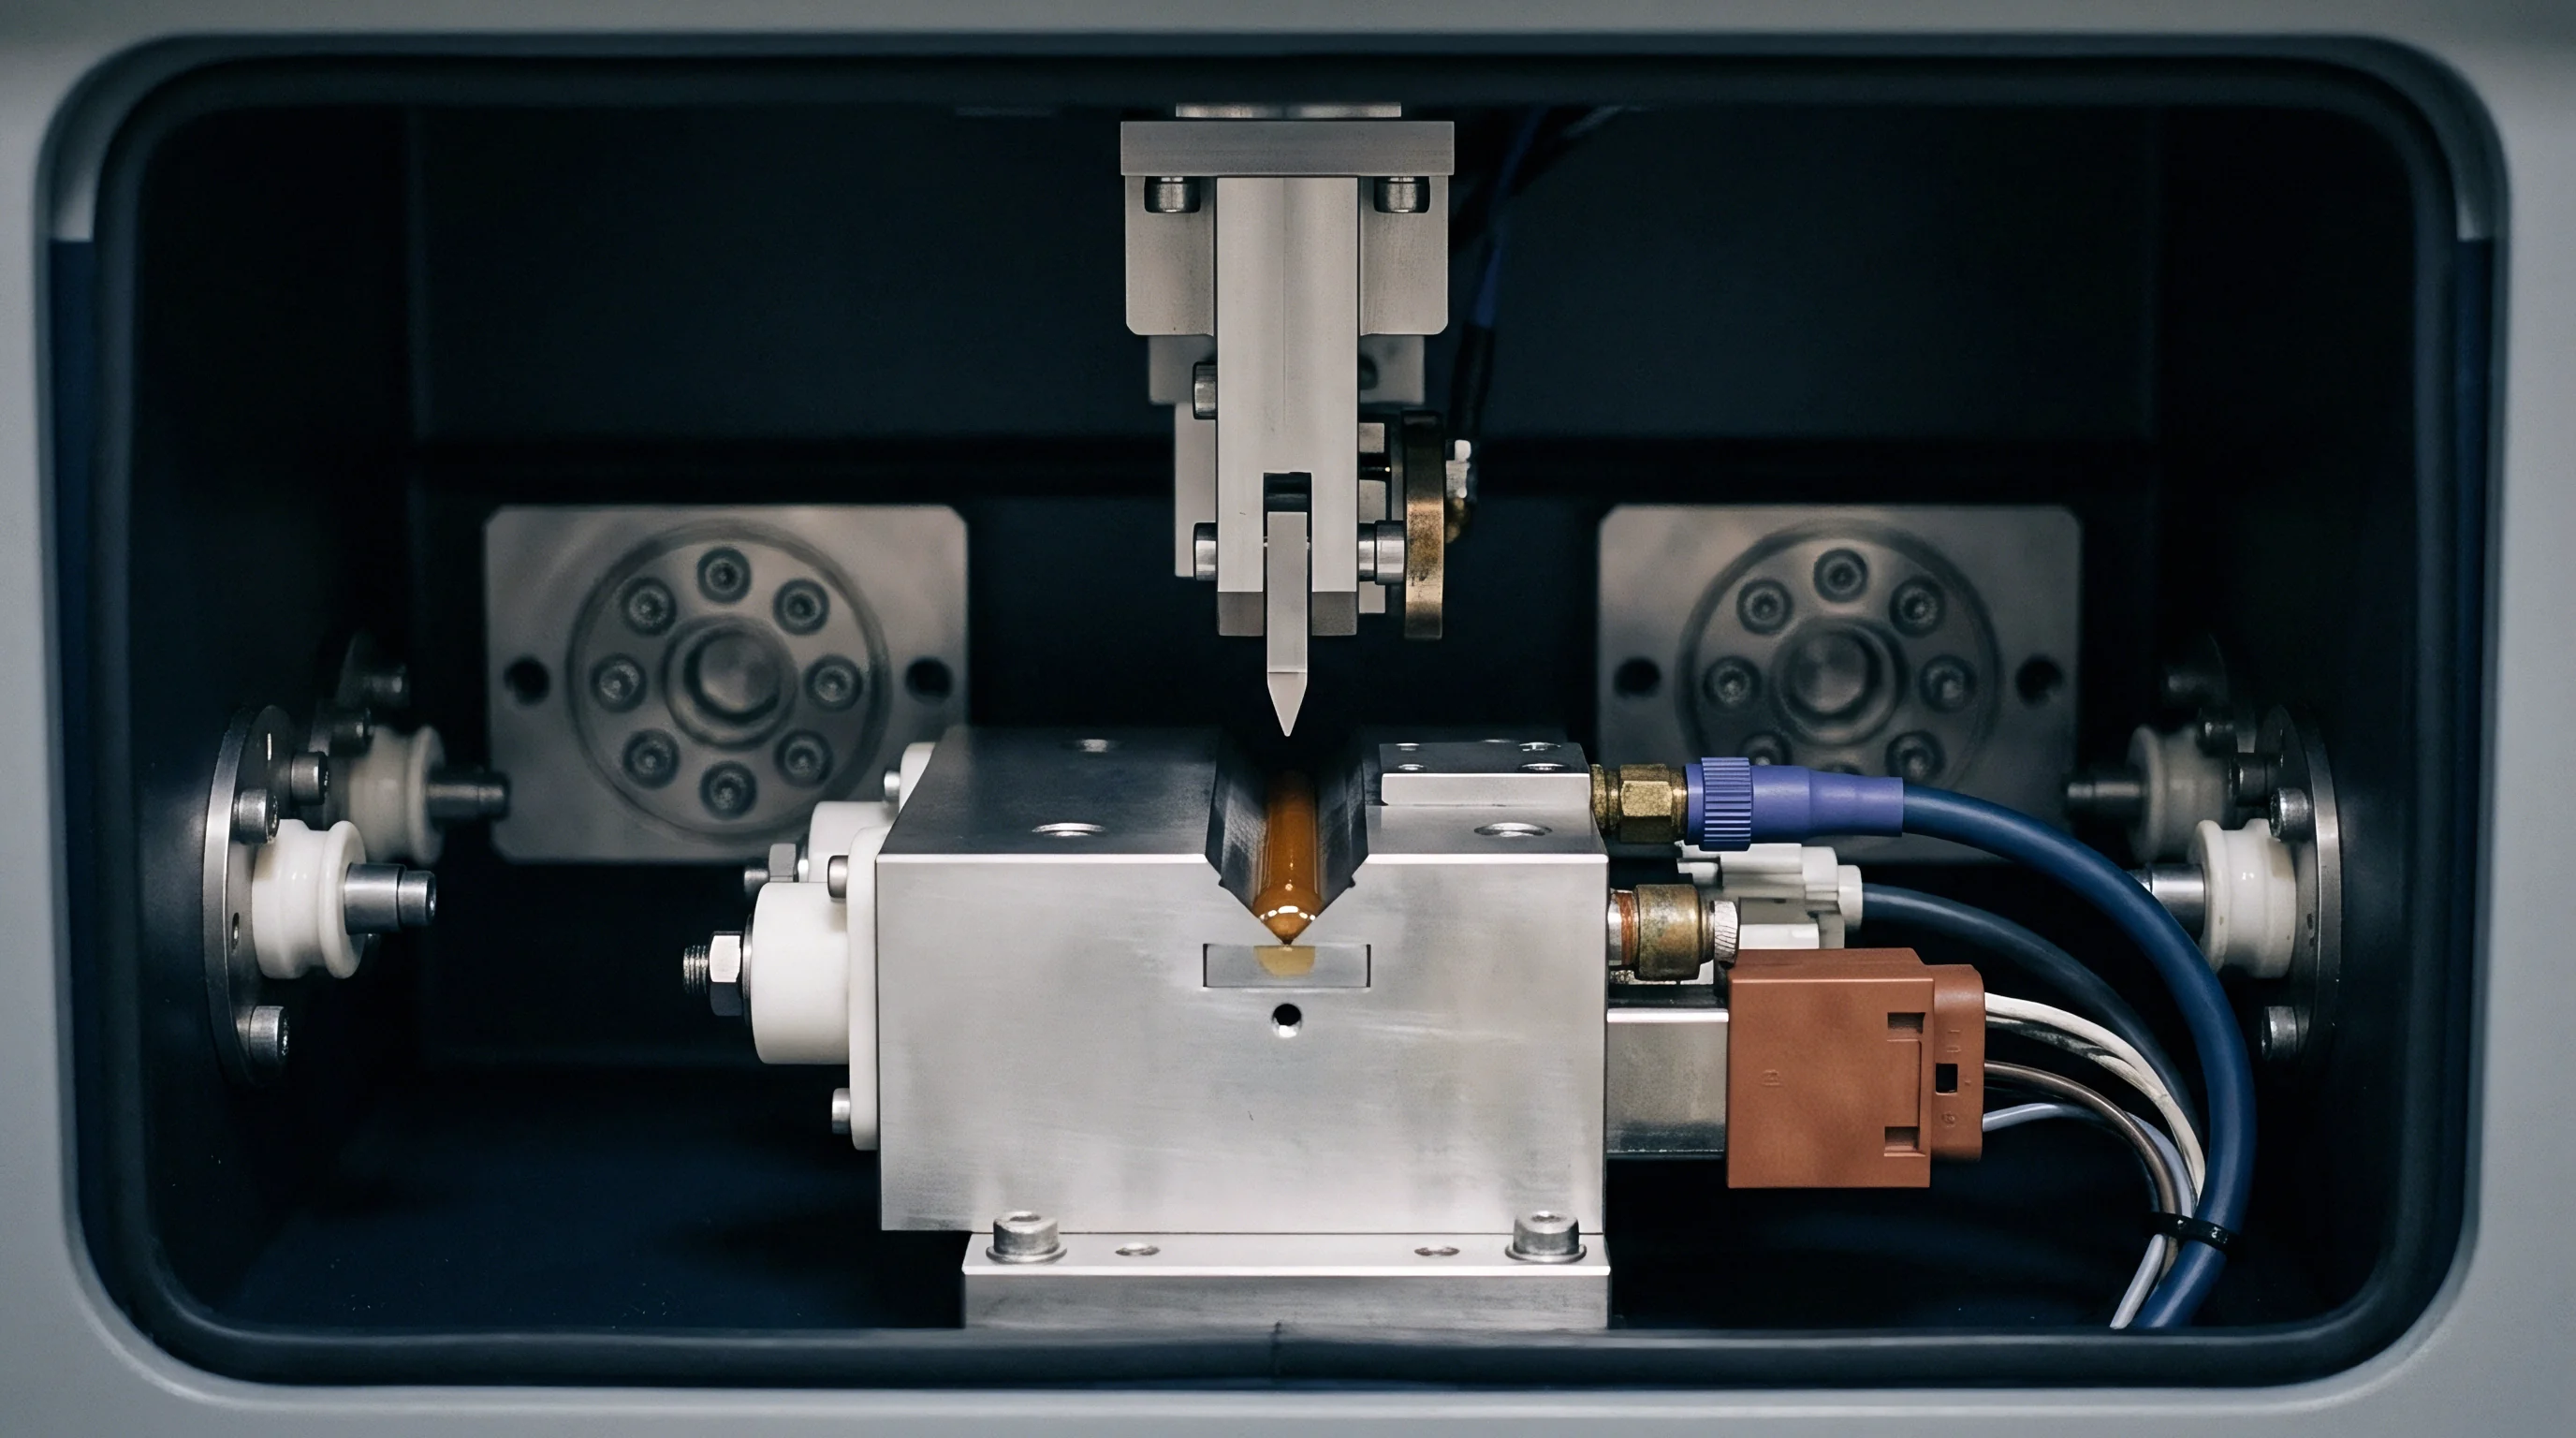
Why Expect Design Timelines to Extend Indefinitely?
Hardware engineering schedules slip routinely due to cross-functional development dependencies. Power supply stabilization delays sensor calibration, while firmware optimization pushes back environmental chamber qualification. Inexperienced technical sales desks assume that schedule slippage preserves evaluation conversion probability on a one-to-one temporal basis.
Empirical survival data reveals this assumption is deeply flawed. When an engineering client extends their system launch timeline by twelve weeks, component conversion likelihood decays rather than shifts laterally.
Timeline elongation introduces competitive vulnerability and technological drift. During an unmanaged four-month launch delay, alternative component manufacturers release iterative revisions featuring superior power density or reduced unit costs. Furthermore, client engineering teams undergo personnel turnover, with incoming systems leads discarding inherited component selections to implement preferred architectures.
Every week of project drift dilutes the proprietary advantage of the sampled silicon.
| Schedule Slippage (Days) | Active Project Retention Rate | Original BoM Retention | Secondary Spec Redesign | Net Purchase Order Probability |
|---|---|---|---|---|
| 0 to 14 | 0.98 | 0.94 | 0.04 | 0.38 |
| 15 to 45 | 0.89 | 0.79 | 0.18 | 0.26 |
| 46 to 90 | 0.74 | 0.58 | 0.36 | 0.14 |
| 91 to 180 | 0.52 | 0.31 | 0.59 | 0.05 |
| 181+ | 0.31 | 0.12 | 0.78 | 0.01 |
Mathematical modeling of schedule drift requires applying an acceleration factor to the Weibull decay parameter. The effective evaluation time t_eff expands according to client delay coefficients. If project slip t_slip exceeds thirty days, the hazard modifier scales according to the ratio of slip duration to original development budget.
The procurement probability drops along a steepened gradient, reflecting the increased exposure to external market shifts.
Client engineering leads defend schedule drift by stating that prototype testing remains active, yet our production line schedules cannot wait for delayed validation outcomes.


Allocation

Production Scheduling against Depreciated Design Win Probabilities
Operating a manufacturing enterprise requires translating probabilistic conversion models into binding factory floor material requirements planning. Committing raw silicon wafers, custom stamping dies, and raw inventory against unweighted sample requests creates balance-sheet write-downs. Production schedulers must apply time-discounted survival probabilities to aggregate sample pipelines, generating an expected demand value that dictates component stocking levels.
Let an active evaluation portfolio contain N open sample engagements, each initiated at time t_i with an estimated production volume V_i upon conversion. The unweighted pipeline presents an aggregate potential volume equal to the sum of all V_i. The expected production demand at future time horizon T equals the sum of each project’s volume weighted by its instantaneous conversion survival function:
E = Sum_{i=1 to N}
where S(T – t_i | t_i) represents the conditional survival probability that account i converts between the current age t_i and horizon T, given non-conversion up to t_i. As t_i grows without an order, this conditional probability drops toward zero. The mathematical formulation systematically strips dead evaluation weight from manufacturing resource commitments, preventing unnecessary raw material purchases.
Unweighted pipeline valuation overstates component demand by more than three hundred percent during mature development quarters.
A rigorous factory allocation framework establishes clear procedural rules for inventory hedging based on mathematical decay tracking:
- Threshold Valuation marks accounts reaching their calculated half-life t_half without qualification milestone confirmation down to secondary production allocation queues, preventing automated wafer release.
- Secondary Triage Protocols mandate that field application engineers initiate direct bench audits when an evaluation hits thirty calendar days of customer silence, verifying physical board power-up.
- Buffer De-allocation releases safety stock earmarked for specific prospective accounts once the project duration crosses the ninetieth percentile of Weibull survival time.
- Commercial Re-qualification requires prospective clients requesting fresh sample lots after protracted delays to submit signed executive validation schedules before shipments proceed.
Implementing mathematical decay modeling bridges technical customer support realities and factory balance-sheet protection. Tracking survival kinetics transforms engineering evaluations from speculative sales promises into reliable, actuarially sound industrial forecasts.
Unresolved questions persist regarding how distributed remote design teams alter baseline hazard parameters across disparate global geographies where direct bench observation remains impossible.