Verifying Pressure Transducer Calibration Logs across Automated Assembly Cells
Log verification requires auditing raw controller integer scaling against laboratory calibration slope certificates to preserve measurement traceability.


Trace
An automated pressing station cycling every 4.2 seconds across three shifts generates 61,714 records every twenty-four hours. Each cycle records a peak force derived from an analog 4-20 milliamp or digital IO-Link pressure transducer mounted to a hydraulic ram. Plant supervisory systems ingest these integers, compare them against process limits, and store the resulting logs in central manufacturing execution databases.
When an external quality audit demands evidence that a 150-bar setpoint represents genuine physical pressure rather than sensor drift, verification begins with the calibration record rather than the real-time telemetry stream.
Verification requires reconciling three disconnected digital artifacts: the laboratory calibration certificate issued under ISO/IEC 17025, the transducer electronic data sheet or parameter configuration file held in the programmable logic controller, and the raw event log written to the factory ledger. Discrepancies between these layers appear frequently during high-throughput manufacturing runs. A calibration laboratory issues an as-found certificate indicating a zero-point shift of 0.85 percent of full-scale output.
The machine technician adjusts the analog input scaling factor inside the controller to zero the human-machine interface without recording the math in maintenance software. That adjustment severs the unbroken chain of measurement traceability.
A calibration certificate without traceable environmental logging leaves sensor drift indistinguishable from mechanical tool wear.
Determining whether logged assembly pressures reflect actual physical loads requires rigorous mathematical matching. Line engineers verify transducer calibration logs by auditing the relationship between laboratory reference voltages, internal digital-to-analog converter counts, and the engineering units committed to historical log files.
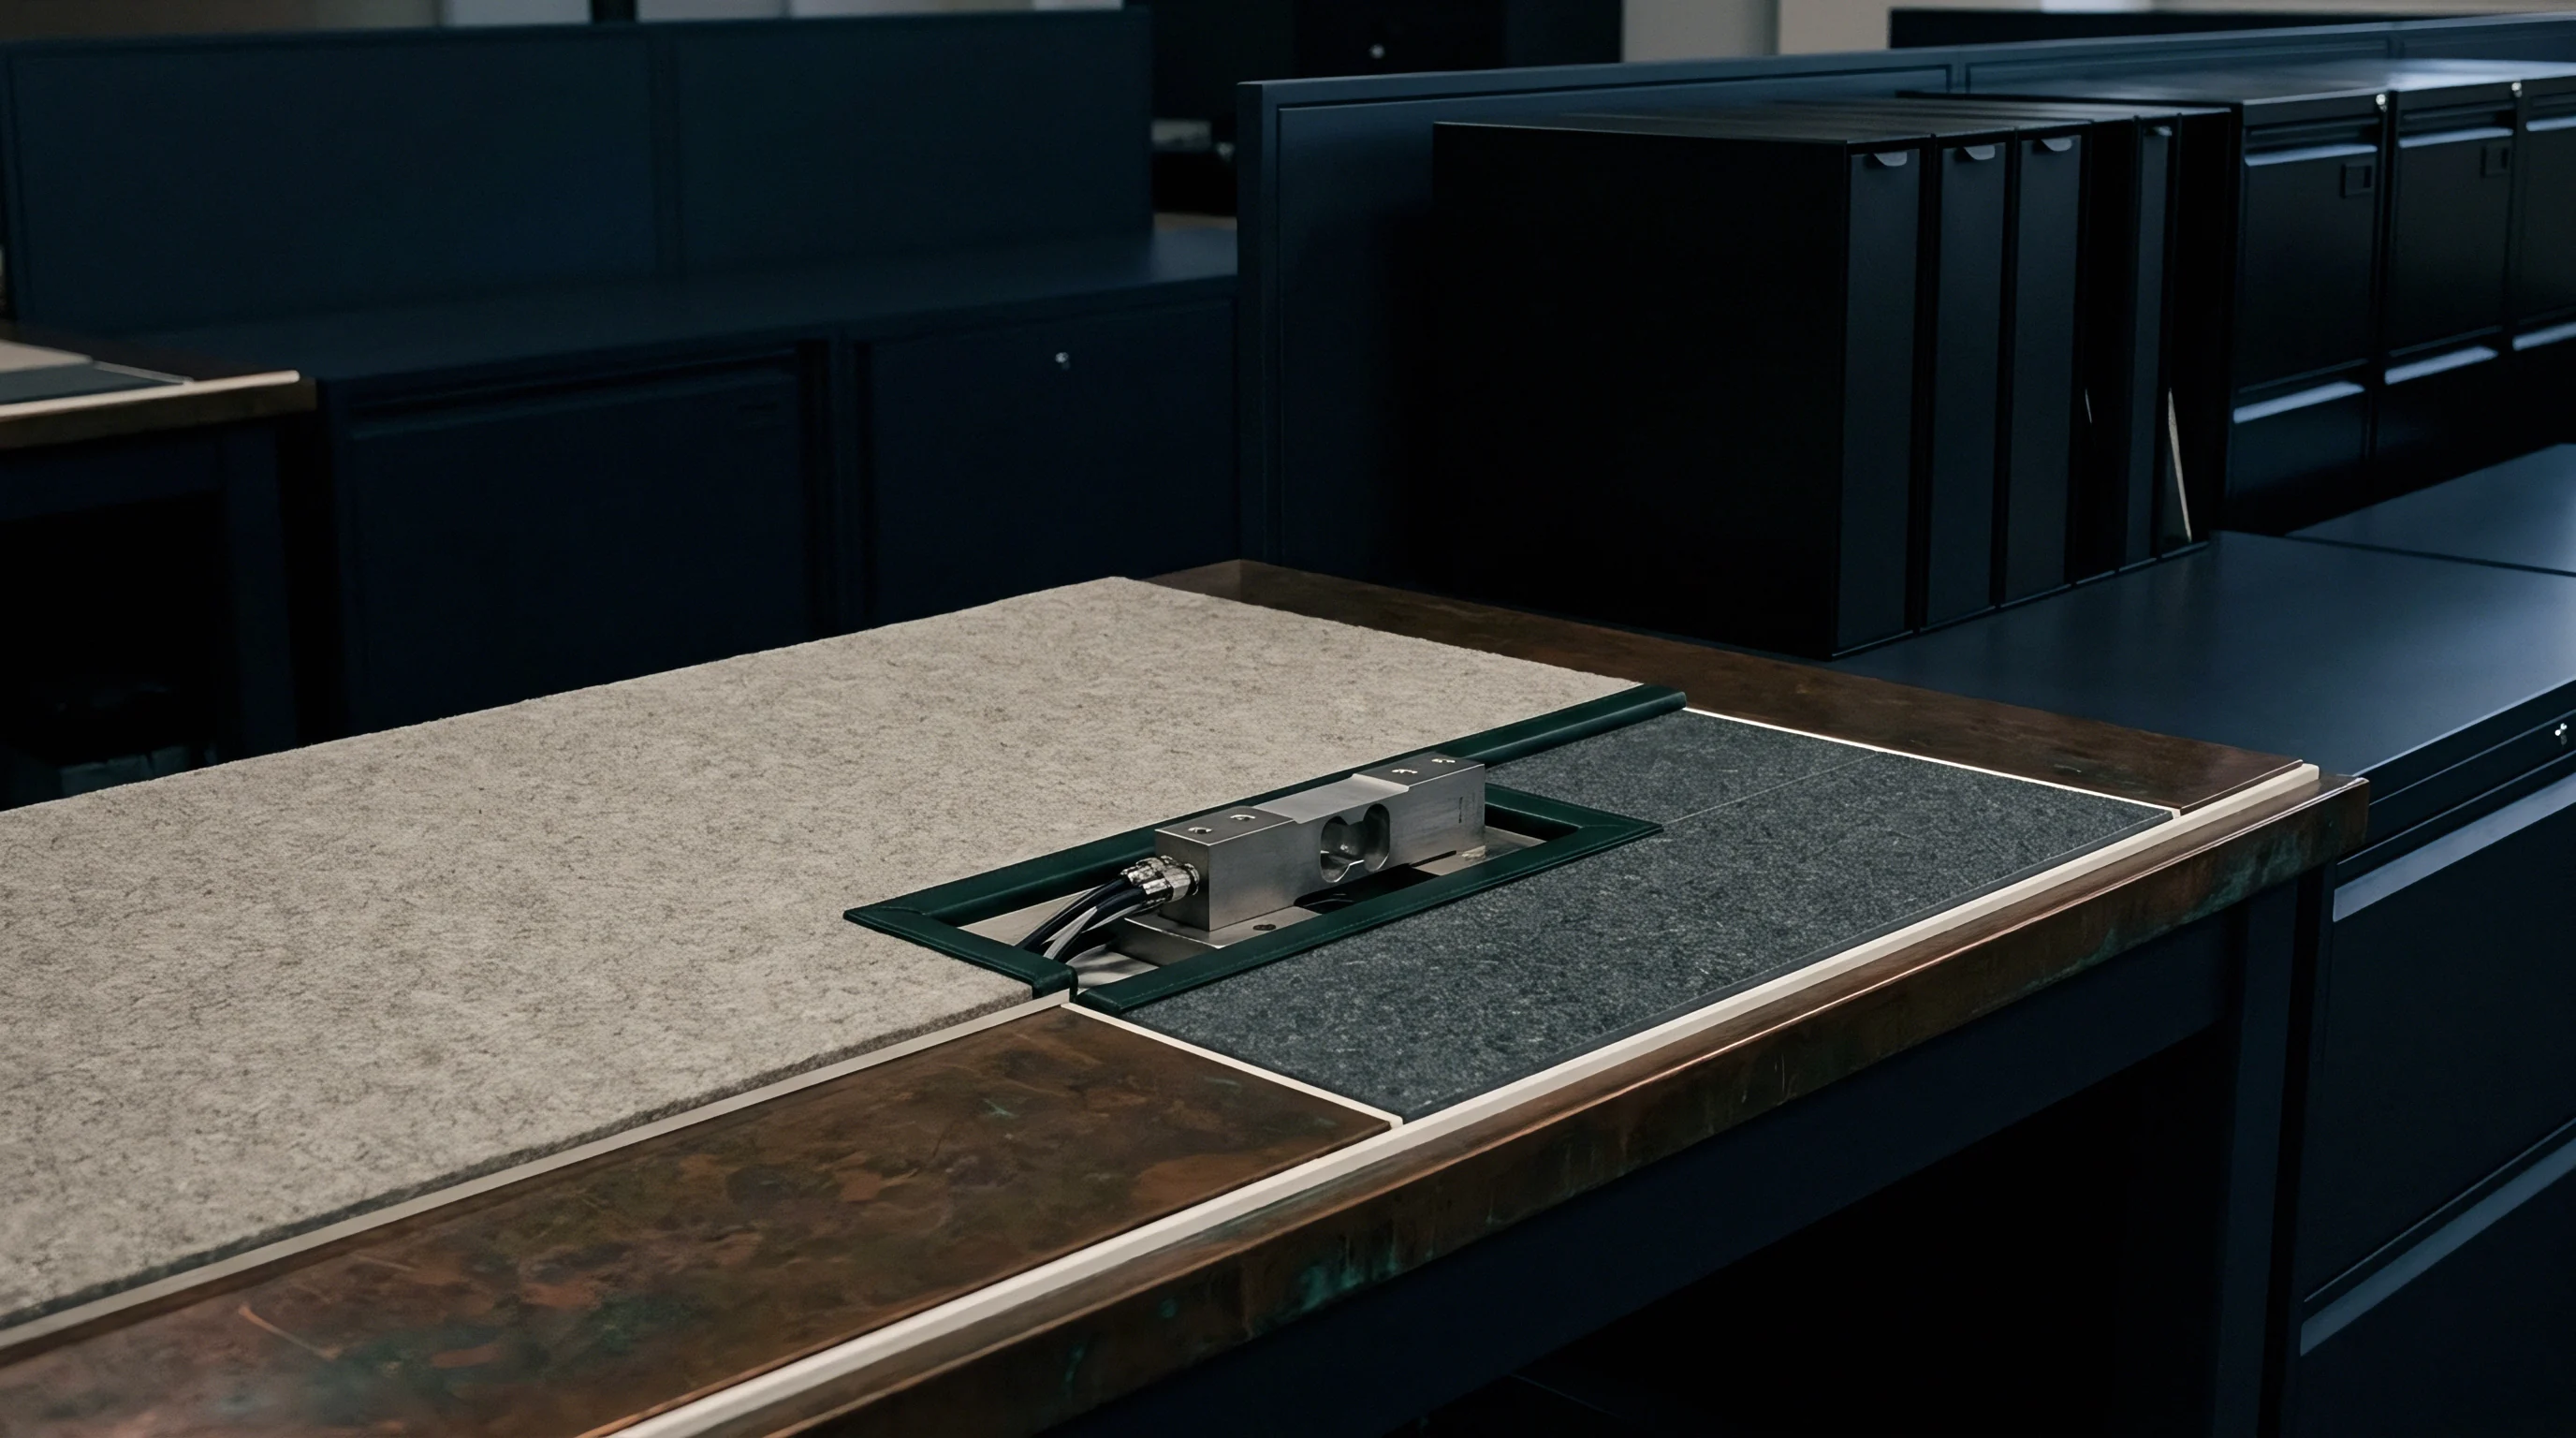
Raw Log Parsing and Parameter Extraction
Raw automated log streams typically store transducer data as raw hexadecimal words or unscaled integer arrays to conserve fieldbus network bandwidth. A Siemens, Beckhoff, or Rockwell programmable automation controller polls the transducer across Profinet, EtherCAT, or EtherNet/IP, packaging the pressure reading into a structured cyclic telegram. The verification team extracts the exact scaling parameters loaded in the system memory blocks.
These parameters define the linear transfer function mapping electric potential or packet payload to bar, kilopascals, or pounds per square inch.
The verification sequence checks whether the intercept and slope coefficients loaded inside the operational controller match the values published on the most recent calibration certificate. Transducers operating on 4-20 milliamp current loops convert pressure using a standardized linear equation. The measured current minus 4.0 milliamps divided by 16.0 milliamps multiplied by the rated range yields the process pressure.
When a controller program incorporates manual offsets, tare functions, or digital moving averages to mask mechanical vibration, those operations alter the raw reading. The verification engineer extracts the unmodified fieldbus payload from the controller archive to validate that logged values match the certified transfer function.

Audit Inconsistencies across Production Cells
Assembly architectures employing multiple duplicate cells introduce substantial log variance through uncoordinated service routines. When Cell 3 undergoes transducer replacement during an unpredicted breakdown, maintenance personnel frequently fit a shelf-spare sensor without calibrating the newly formed loop. The replacement transducer carries an individual calibration factor of 10.015 volts per 250 bar, whereas the damaged sensor operated at 9.982 volts per 250 bar.
Retaining the defunct unit scaling inside the controller parameter block introduces systematic, unrecorded measurement errors across every subsequent assembly.
Verification audits catch these divergences by running cross-cell statistical comparisons on identical operations. If Cell 1, Cell 2, and Cell 4 record mean press values of 112.4 bar with a standard deviation of 1.2 bar on a specific interference fit, while Cell 3 records 118.6 bar under identical feed stock and tool geometry, the difference points to parameter mismatch or uncorrected zero drift. Cross-checking the sensor serial numbers in the operational logs against the laboratory recalibration database confirms whether the instrument running on the line matches the instrument documented on the compliance dossier.
The operational consequence lands immediately: unverified transducer scaling turns automated cell logs into ungrounded text files that fail formal regulatory scrutiny.


Span
Calibration logs document sensor performance across an instrument’s full operating envelope, defining precision through fixed span checkpoints. Standard commercial pressure transducers rely on piezoresistive silicon chips, thin-film polysilicon strain gauges, or bonded foil gauges exposed to hydraulic fluid or pressurized air. These physical elements exhibit systematic non-linearity, hysteresis, and thermal sensitivity that laboratory calibration certificates capture through multi-point measurement matrices.
Verifying a log requires reading the recorded points against standard calibration intervals defined under ASME B40.100 or EURAMET cg-17 guidelines. A standard five-point calibration records output at 0, 25, 50, 75, and 100 percent of maximum rated capacity during an ascending pressure cycle, followed immediately by identical measurements taken across a descending cycle. Comparing the upward and downward values determines mechanical hysteresis within the transducer sensing diaphragm.
When cell logs document pressure spikes approaching maximum rated limits during component seating, relying on single-point field zeroing introduces unquantified errors across high-pressure regions.
| Calibration Checkpoint | Reference Applied Bar | Theoretical Output mA | Ascending Actual mA | Descending Actual mA | Hysteresis Error Percent |
|---|---|---|---|---|---|
| Zero Point | 0.00 | 4.000 | 4.008 | 4.012 | 0.025 |
| First Quarter | 62.50 | 8.000 | 8.016 | 8.024 | 0.050 |
| Mid Span | 125.00 | 12.000 | 12.022 | 12.038 | 0.100 |
| Third Quarter | 187.50 | 16.000 | 16.018 | 16.032 | 0.088 |
| Full Scale | 250.00 | 20.000 | 19.992 | 19.992 | 0.000 |
The calculated hysteresis error in the table demonstrates why single-point calibration fails high-reliability manufacturing checks. The transducer exhibits its widest mechanical lag at mid-span, where descending output exceeds ascending output by 0.016 milliamps, translating to 0.25 bar of physical pressure error. If an assembly press operates within this 125-bar region, an engineer auditing the calibration record notes that the controller software assumes a perfectly linear, non-hysteretic line.
When critical safety thresholds sit near this mid-span level, unverified hysteresis compromises product hold decisions.
Evaluating Environmental Influence Variables
Automated manufacturing environments subject transducers to dynamic temperature swings, high electromagnetic noise, and cyclic pressure shocks. Calibration certificates record baseline figures measured inside clean rooms held at 20 degrees Celsius with relative humidity stabilized at 45 percent. Production assembly cells expose identical transducers to high-pressure washdowns, thermal radiation from nearby induction heaters, and cooling-fan exhaust cycles.
Piezoresistive transducers incorporate internal temperature compensation circuits, yet remaining thermal coefficients routinely alter zero balances and operational spans.
Piezoresistive bridge circuits suffer from thermal zero shift, commonly specified as plus or minus 0.02 percent of full scale per degree Celsius. A transducer installed in an unconditioned cell where ambient temperatures swing from 15 degrees Celsius in winter mornings to 38 degrees Celsius during peak summer operations experiences an operating shift exceeding 0.46 percent of full scale purely from heat. If the calibration log lacks thermal compensation coefficients or seasonal adjustment dates, historical production records cannot be mathematically corrected after assembly defects emerge.

Mechanical Cycling and Strain Degradation
Continuous dynamic loads induce mechanical fatigue within the transducer isolation diaphragm and underlying adhesive bonds. A transducer rated for 10 million cycles operating on a four-second index time exhausts its design fatigue life in under eighteen months of continuous plant operation. As internal strain gauges age, the metal lattice permanently deforms, driving continuous downward zero drift and reduced span sensitivity.
Engineers verifying logs look for systematic drift patterns over successive calibration sheets. When the as-found zero measurement drifts in the same direction across three consecutive audit periods, the sensing element has reached plastic fatigue. Transducers exhibiting linear wear continue to pass single-point zero adjustments while their span linearity degrades past allowable process limits.
A comprehensive log verification links the serial-number history of each transducer across consecutive calibrations rather than treating each inspection event as an isolated certificate.
Skipping multi-point span verification leaves production teams exposed to progressive calibration drift that standard single-point field zeroes cannot detect.

Fault
Automated logging pipelines contain structural vulnerabilities that corrupt physical pressure telemetry between the pipe fitting and the central database disk. The hardware chain begins at the wetted diaphragm, transfers analog current across shielded multi-conductor cabling, enters an input module, converts via analog-to-digital hardware, runs through fieldbus communications, and ends in a structured query language database. A breakdown in any link along this route compromises the integrity of calibration and operation logs.
Field installations present identifiable failure modes that distort calibration tracking data:
- Uncompensated Analog Attenuation occurs when long field wire runs introduce resistive voltage drops across 0-10 volt signaling paths, causing digital controllers to under-read line pressures regardless of laboratory sensor precision.
- Controller Scaling Overwrites take place when automation software updates overwrite custom multi-point calibration tables with generic factory defaults during firmware reflashing.
- Thermal Hysteresis Pinning happens when rapid hydraulic oil heating expands sensor housings, locking internal gauge diaphragms into false positive baseline stresses that register as persistent line pressure.
- Asynchronous Timestamp Latency develops when local programmable automation controllers cache pressure bursts locally and flush data packets to centralized historical logs with incorrect temporal headers.
- Ground Loop Bias Currents introduce stray direct currents into instrument cable shields, producing constant fractional milliamp offsets that shift both zero values and calibrated span slopes.
Identifying these conditions requires testing the installed electrical circuit against reference logs. Verification teams deploy precision current generators and digital multimeters directly at the control cabinet terminal blocks, decoupling field instruments to isolate wiring faults from transducer degradation. If an external current calibrator injects exactly 12.000 milliamps at the terminal blocks but the human-machine interface displays 123.8 bar instead of the expected 125.0 bar, the fault lies within input card analog-to-digital conversion factors or controller software logic rather than in the fluid line.

Shielding and Ground Loop Infiltration
High-current motor drives, servo controllers, and robotic welding actuators inject extreme electrical noise into adjacent control conduits. When analog transducer cabling shares trays with variable-frequency drive power wiring, electromagnetic induction distorts the continuous pressure signal. An improperly grounded cable shield acts as an antenna, creating common-mode noise voltages that swamp low-level millivolt bridge outputs.
Verification logs that capture fast-sampling waveform data reveal electromagnetic interference through distinct high-frequency ripple patterns superimposed on hydraulic press curves. Clean hydraulic pressure curves display smooth, monotonic pressure rise until mechanical contact occurs. A log contaminated by 50-hertz or 60-hertz power line noise displays cyclic oscillations across what should be stable holding periods.
If the logging system applies aggressive digital filtering to flatten this noise, the filter obscures true hydraulic pressure spikes that exceed component yield limits.

Fieldbus Packet Jitter and Buffering Lag
Digital fieldbus protocols mitigate analog noise issues by placing the analog-to-digital converter directly inside the transducer body, communicating via digital words. This architecture introduces a separate failure mode: network latency and packet buffering jitter. In complex assembly lines with high network utilization, cyclic process data can drop packets or deliver them out of temporal sequence.
When the industrial network experiences bandwidth saturation, programmable logic controllers reuse the last known valid reading across consecutive logic scans. An automated press cycle lasting only 200 milliseconds during the final seating phase requires sub-millisecond logging resolution to record the true peak load. If packet delivery stalls for 30 milliseconds due to high fieldbus traffic, the controller logs an arbitrary holding pressure instead of the transient peak.
Verifying transducer logs requires auditing fieldbus packet transmission timestamps against hardware interrupt events to ensure logged peaks represent physical conditions rather than communications lag.
ISO/IEC 17025 Clause 7.8.2.1 invalidates test records when calibration documents omit environmental limits and reference instrument serial identifiers.
Suppliers routinely dismiss discrepancies by claiming that controller auto-zero algorithms eliminate any meaningful analog transmission error.

Audit
Formal verification of transducer logs demands an executable audit sequence that moves sequentially from physical serial inspection to raw database verification. Auditors avoid relying on high-level graphical reporting screens, which frequently smooth raw process values and hide uncalibrated offsets. The audit protocol examines original, immutable log tables, configuration parameter registers, and certified laboratory reference sheets.
- The verification specialist matches the physical laser-etched serial number, model code, and pressure rating on the installed transducer directly against the active line configuration document and laboratory certificate.
- The specialist reads the live analog input module register values inside the programmable automation controller memory blocks, recording current scaling multipliers, manual offsets, and smoothing filter parameters.
- The specialist disconnects the process connection, confirms venting to atmospheric pressure, and records the active static zero-point reading against the certificate limits.
- The specialist compares time-stamped machine event logs against raw database entries for fifty sequential press cycles, verifying that logged pressure values correspond with calibrated register math.
- The specialist compiles the as-found operational data, calculates the total expanded measurement uncertainty, and signs the verification dossier.
This sequential approach prevents undocumented hardware substitutions from escaping notice. It ensures that every mechanical component installed on the automated assembly line possesses a verified legal pedigree trace.
Mathematical Calculation of Expanded Measurement Uncertainty
Quantifying whether an operational log verifies process compliance requires computing combined expanded measurement uncertainty according to international standards. The laboratory certificate provides baseline reference uncertainty, but the installed operating cell introduces additional error distributions that accumulate through root-sum-square calculations. Neglecting input card resolution, thermal coefficients, and ambient supply drift produces an artificially optimistic assessment of measurement precision.
To establish the absolute error bound of a logged pressure reading, the audit calculation synthesizes individual standard uncertainties. Consider a piezoresistive transducer with a 200-bar full-scale range deployed on an automated cell:
Reference calibrator uncertainty from laboratory certificate: 0.05 bar (normal distribution, k = 2).
Sensor non-linearity and hysteresis: 0.20 bar (rectangular distribution).
Temperature drift across 15 degrees Celsius ambient cell variance: 0.18 bar (rectangular distribution).
Analog-to-digital converter quantization error: 0.03 bar (rectangular distribution).
Power supply output voltage drift: 0.04 bar (rectangular distribution).
Rectangular distributions require dividing the full-width parameter by the square root of three to calculate the standard uncertainty. The calculation converts all elements to standard uncertainties before summation:
Reference calibrator standard uncertainty: 0.05 divided by 2 equals 0.025 bar.
Non-linearity standard uncertainty: 0.20 divided by 1.732 equals 0.115 bar.
Temperature drift standard uncertainty: 0.18 divided by 1.732 equals 0.104 bar.
Converter quantization standard uncertainty: 0.03 divided by 1.732 equals 0.017 bar.
Power drift standard uncertainty: 0.04 divided by 1.732 equals 0.023 bar.
Summing the squared values yields the combined variance: 0.000625 plus 0.013225 plus 0.010816 plus 0.000289 plus 0.000529 equals 0.025484 bar squared. Taking the square root of this sum produces a combined standard uncertainty of 0.160 bar. Applying a coverage factor of k = 2 for an approximate 95 percent confidence interval gives an expanded measurement uncertainty of plus or minus 0.32 bar.
| Uncertainty Component | Value (+/- Bar) | Probability Distribution | Divisor | Standard Uncertainty (Bar) |
|---|---|---|---|---|
| Calibration Standard Reference | 0.050 | Normal (k=2) | 2.000 | 0.025 |
| Non-Linearity and Hysteresis | 0.200 | Rectangular | 1.732 | 0.115 |
| Operating Temperature Drift | 0.180 | Rectangular | 1.732 | 0.104 |
| A/D Card Quantization | 0.030 | Rectangular | 1.732 | 0.017 |
| Excitation Line Drift | 0.040 | Rectangular | 1.732 | 0.023 |
The audit table reveals that temperature drift and mechanical sensor non-linearity constitute over 85 percent of the total uncertainty budget. An engineer attempting to tighten process limits by purchasing a more expensive analog input module ignores the dominant physical drivers. The expanded uncertainty value must be compared against the target engineering tolerance.
If an assembly specification defines a seating pressure of 140 bar plus or minus 0.5 bar, an expanded uncertainty of 0.32 bar consumes 64 percent of the entire customer tolerance band.
Are Real-Time Controller Calibration Offsets Traceable?
Automation software platforms increasingly offer runtime self-calibration routines designed to compensate for mechanical wear and changing ambient conditions. These software algorithms calculate a rolling zero baseline by recording the analog current output during the reset dwell time of the machine cycle, automatically deducting that value from the subsequent press cycle. While this practice stabilizes visual trends on operator display panels, it breaks formal data verification chains unless the controller writes the dynamically calculated offset to an immutable log with every cycle.
Auditing software-offset routines requires evaluating the raw database schema. When an automated assembly system records only the final corrected pressure value, external verifiers cannot determine whether a logged 120-bar value represents 120 bar of hydraulic force or 115 bar of force supplemented by a 5-bar dynamic software correction. Robust verification frameworks prohibit dynamic offset adjustment without concurrent logging of the raw sensor signal, the active correction value, and the governing algorithm version.
Without immutable logs of dynamic controller adjustments, manufacturing quality dossiers remain vulnerable to immediate customer rejection during formal production part approval audits.

Ledger
The final phase of calibration log verification evaluates the long-term data repository where automated cell records reside. Automated production lines generate continuous streams of critical process parameters that export to relational enterprise databases, industrial data historians, or distributed manufacturing ledgers. Ensuring that logged calibration values remain uncorrupted over multi-year retention horizons requires continuous digital validation mechanisms.
Database administrators verify record immutability by auditing system security permissions and transaction history logs. An automated assembly cell operating under regulated quality systems prevents arbitrary alterations to historical pressure readings by operators, engineers, or plant management. When maintenance technicians recalibrate an active cell transducer, the database records the transition event as a new entry containing the valid timestamp, technician identifier, old calibration factors, and new calibration factors.
Overwriting previous calibration parameters inside existing historical tables invalidates historical trace verification.
Verification holds only when database tables record unscaled analog counts alongside scaled engineering units.
System architects implement cryptographic checksums and hash chains across automated manufacturing execution records. Generating a SHA-256 hash across the combined string of cycle timestamp, cell identifier, sensor serial number, raw digital value, and scaled pressure produces an immutable fingerprint for every assembly cycle. If database records undergo subsequent manual manipulation to conceal a production line pressure drop, the computed hash fails to validate against the stored signature block.
This digital signature structure provides absolute mathematical proof that historical press logs precisely reflect the physical state documented during certified transducer calibration cycles.
Whether enterprise database architectures can maintain this level of cryptographic record validation under continuous sub-second cycle times across thousands of networked assembly cells remains an open engineering question.