Predictive Room Temperature Characterization Strategies for Eliminating Sub-Zero Thermal Ramp Resonator Testing Requirements
Predictive 25°C electromechanical parameter extraction eliminates sub-zero thermal ramp testing by accurately modeling low-temperature resonator frequency drift.
Crystal

Acoustic Energy Distribution at Ambient Thresholds
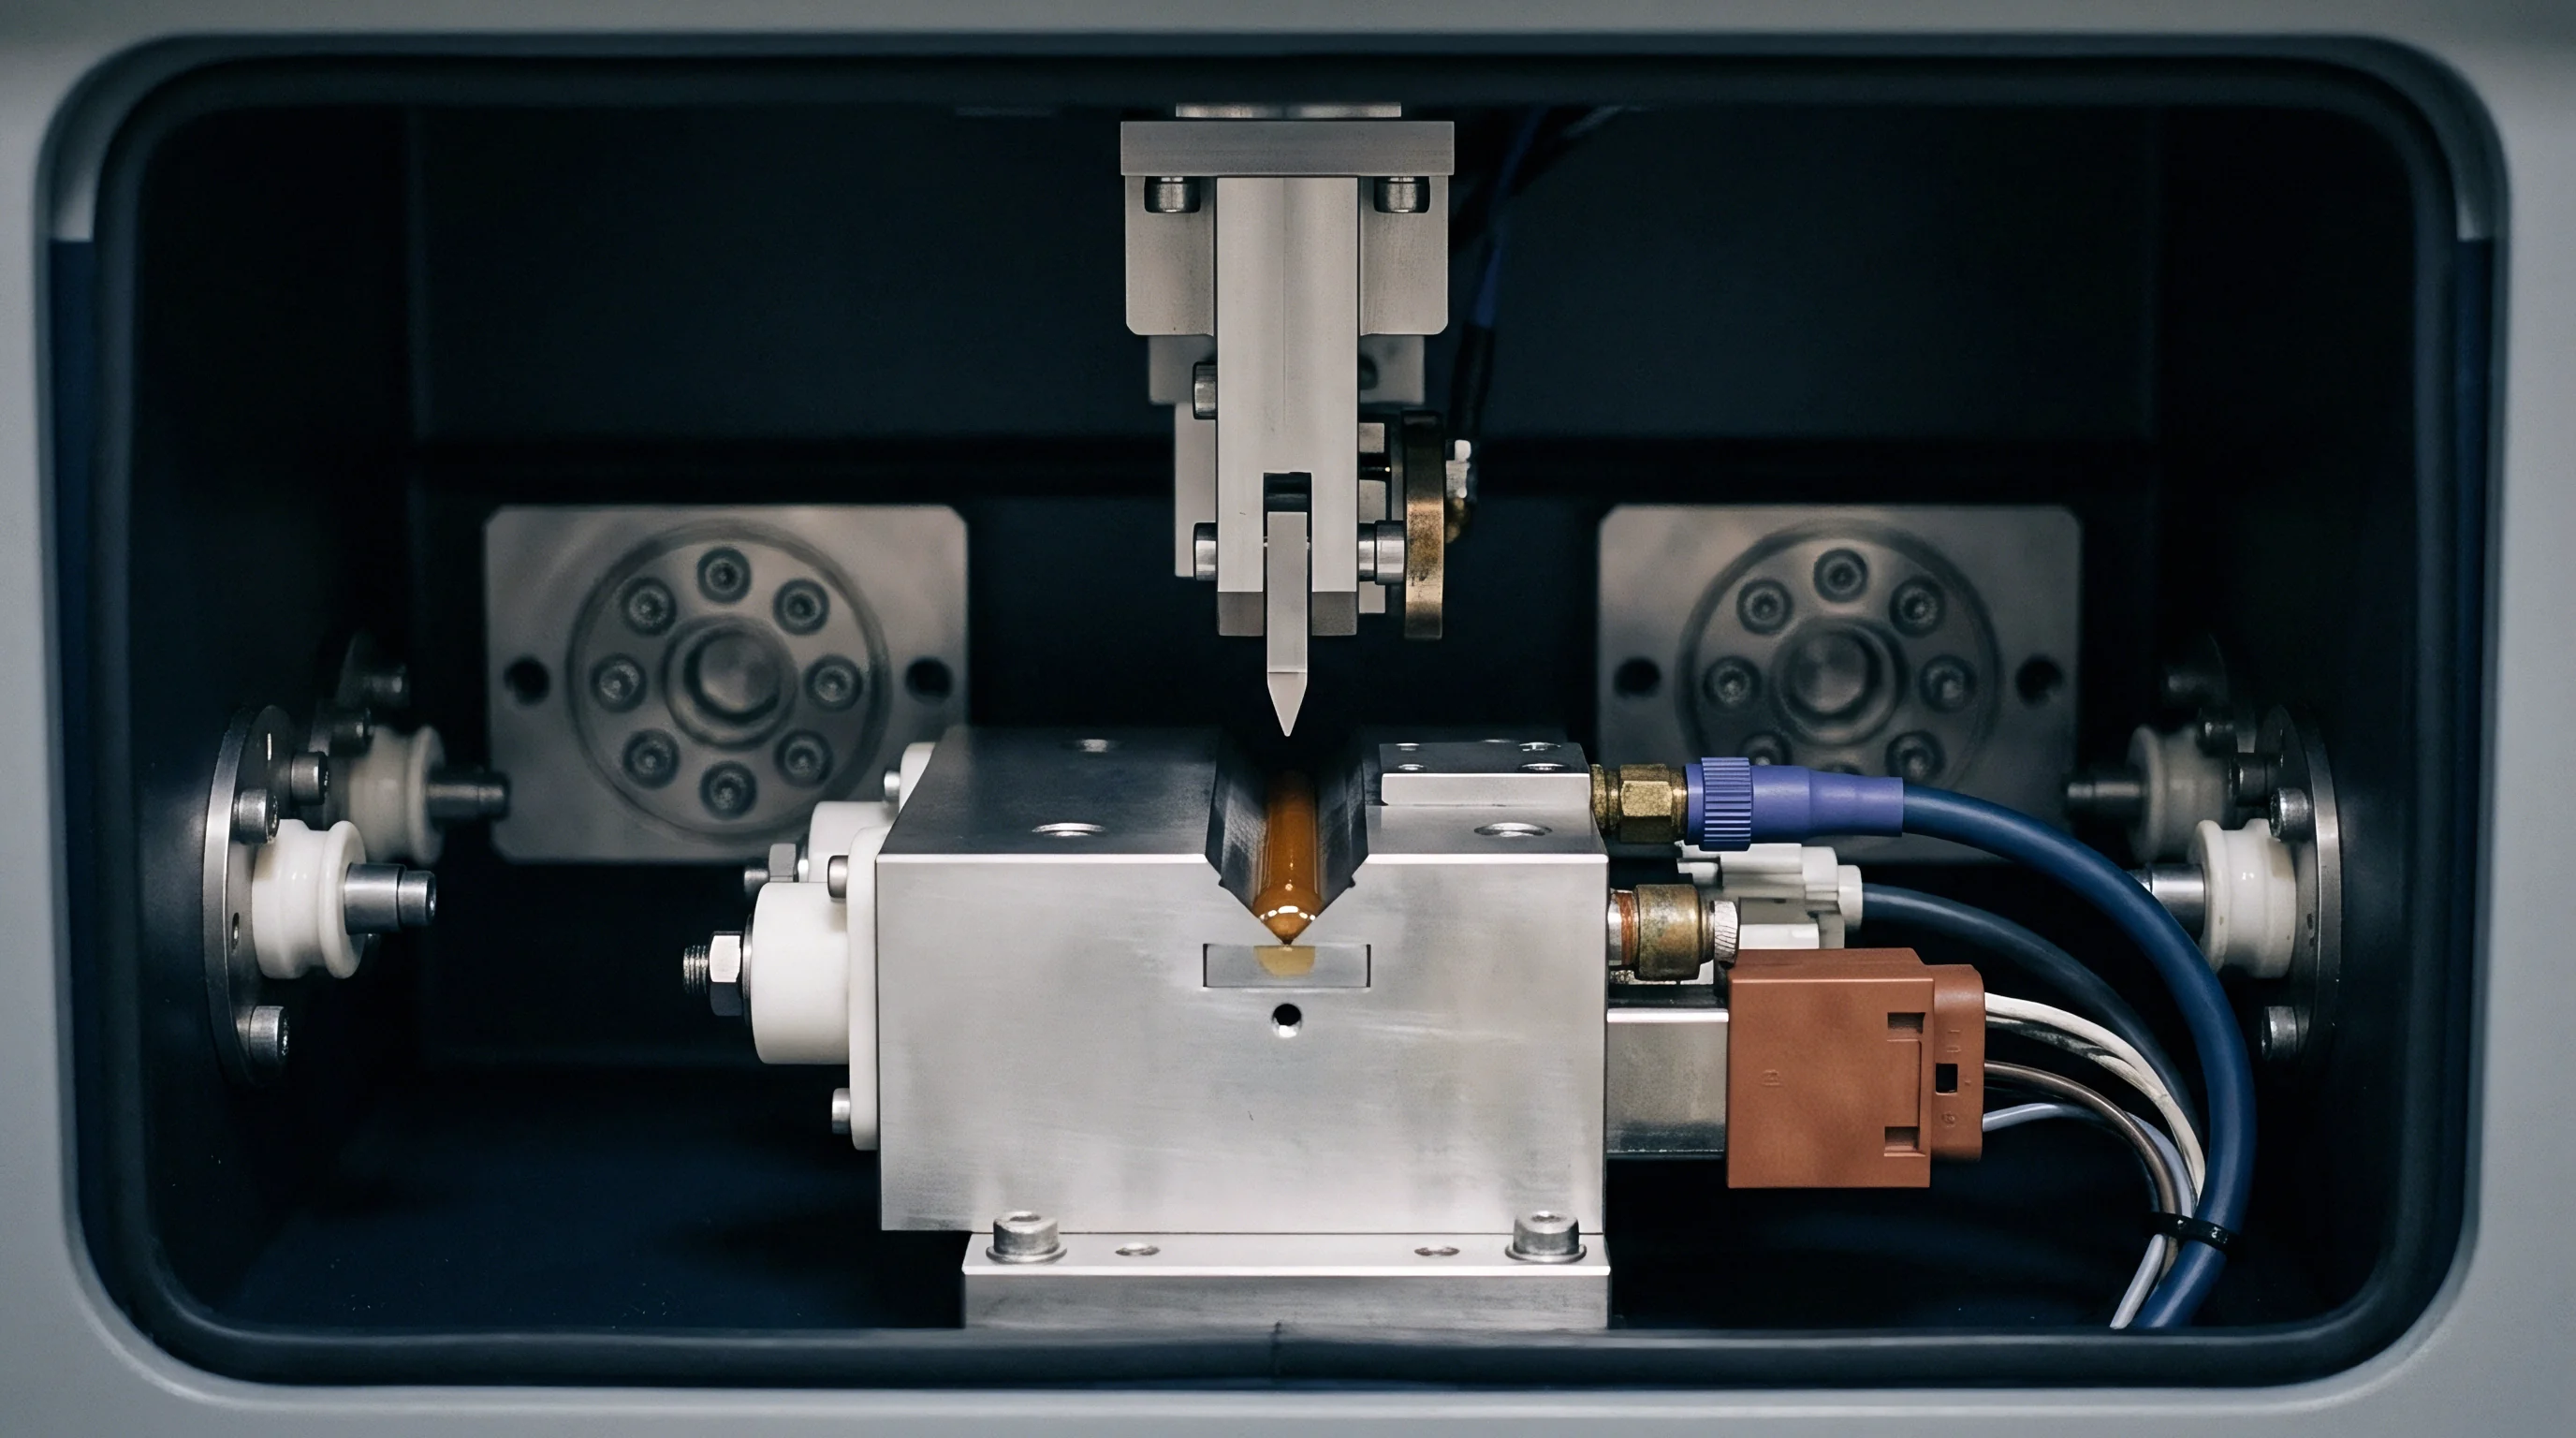
Piezoelectric thin films and quartz substrates store mechanical energy through strain tensor fields operating within defined lattice geometries. High-frequency timing components deployed in base station transceivers, orbital payloads, and automotive radar modules must maintain frequency stability within narrow tolerances across operational temperature bands extending down to negative forty degrees Celsius. Traditional quality assurance relies on physical environmental chamber sweeps where automated test equipment steps packaged devices through cryogenic thermal ramps.
That screening approach consumes up to forty-five minutes per device to allow full thermal dissipation through the package base and lead structure. The physical thermal ramp enforces a strict floor on manufacturing velocity while multiplying electrical power costs in volume assembly plants.
Precision vector impedance analysis performed at twenty-five degrees Celsius isolates the physical physical parameters that determine sub-zero frequency behavior without physical refrigeration. At room temperature, piezoelectric coupling efficiency, parasitic series resistance, parallel capacitance, and motional inductance define the equivalent Butterworth-Van Dyke circuit model. Small deviations in film thickness, material density, or crystalline dislocation densities alter ambient drive-level dependence and acoustic loss profiles.
These microstructural variations correlate directly with higher-order thermal expansion and elastic stiffness coefficients, allowing analytical prediction of low-temperature frequency drift.
A thirty-nanometer deviation in aluminum nitride film thickness alters twenty-five degree drive-level power handling by two decibels and predicts a four part-per-million frequency droop at negative forty degrees.
Mechanical stress states within the packaged die modify acoustic mode shapes during thermal contraction. Ambient automated wafer probing measures these strain conditions prior to singulation. By capturing high-frequency S-parameter spectra across varied input power steps at ambient room temperature, testing systems construct a full electromechanical fingerprint.
That fingerprint contains the mathematical signature of third-order elastic constants, making thermal chamber screening redundant for qualified production lots.
Thermal Sweep Bottlenecks in Production
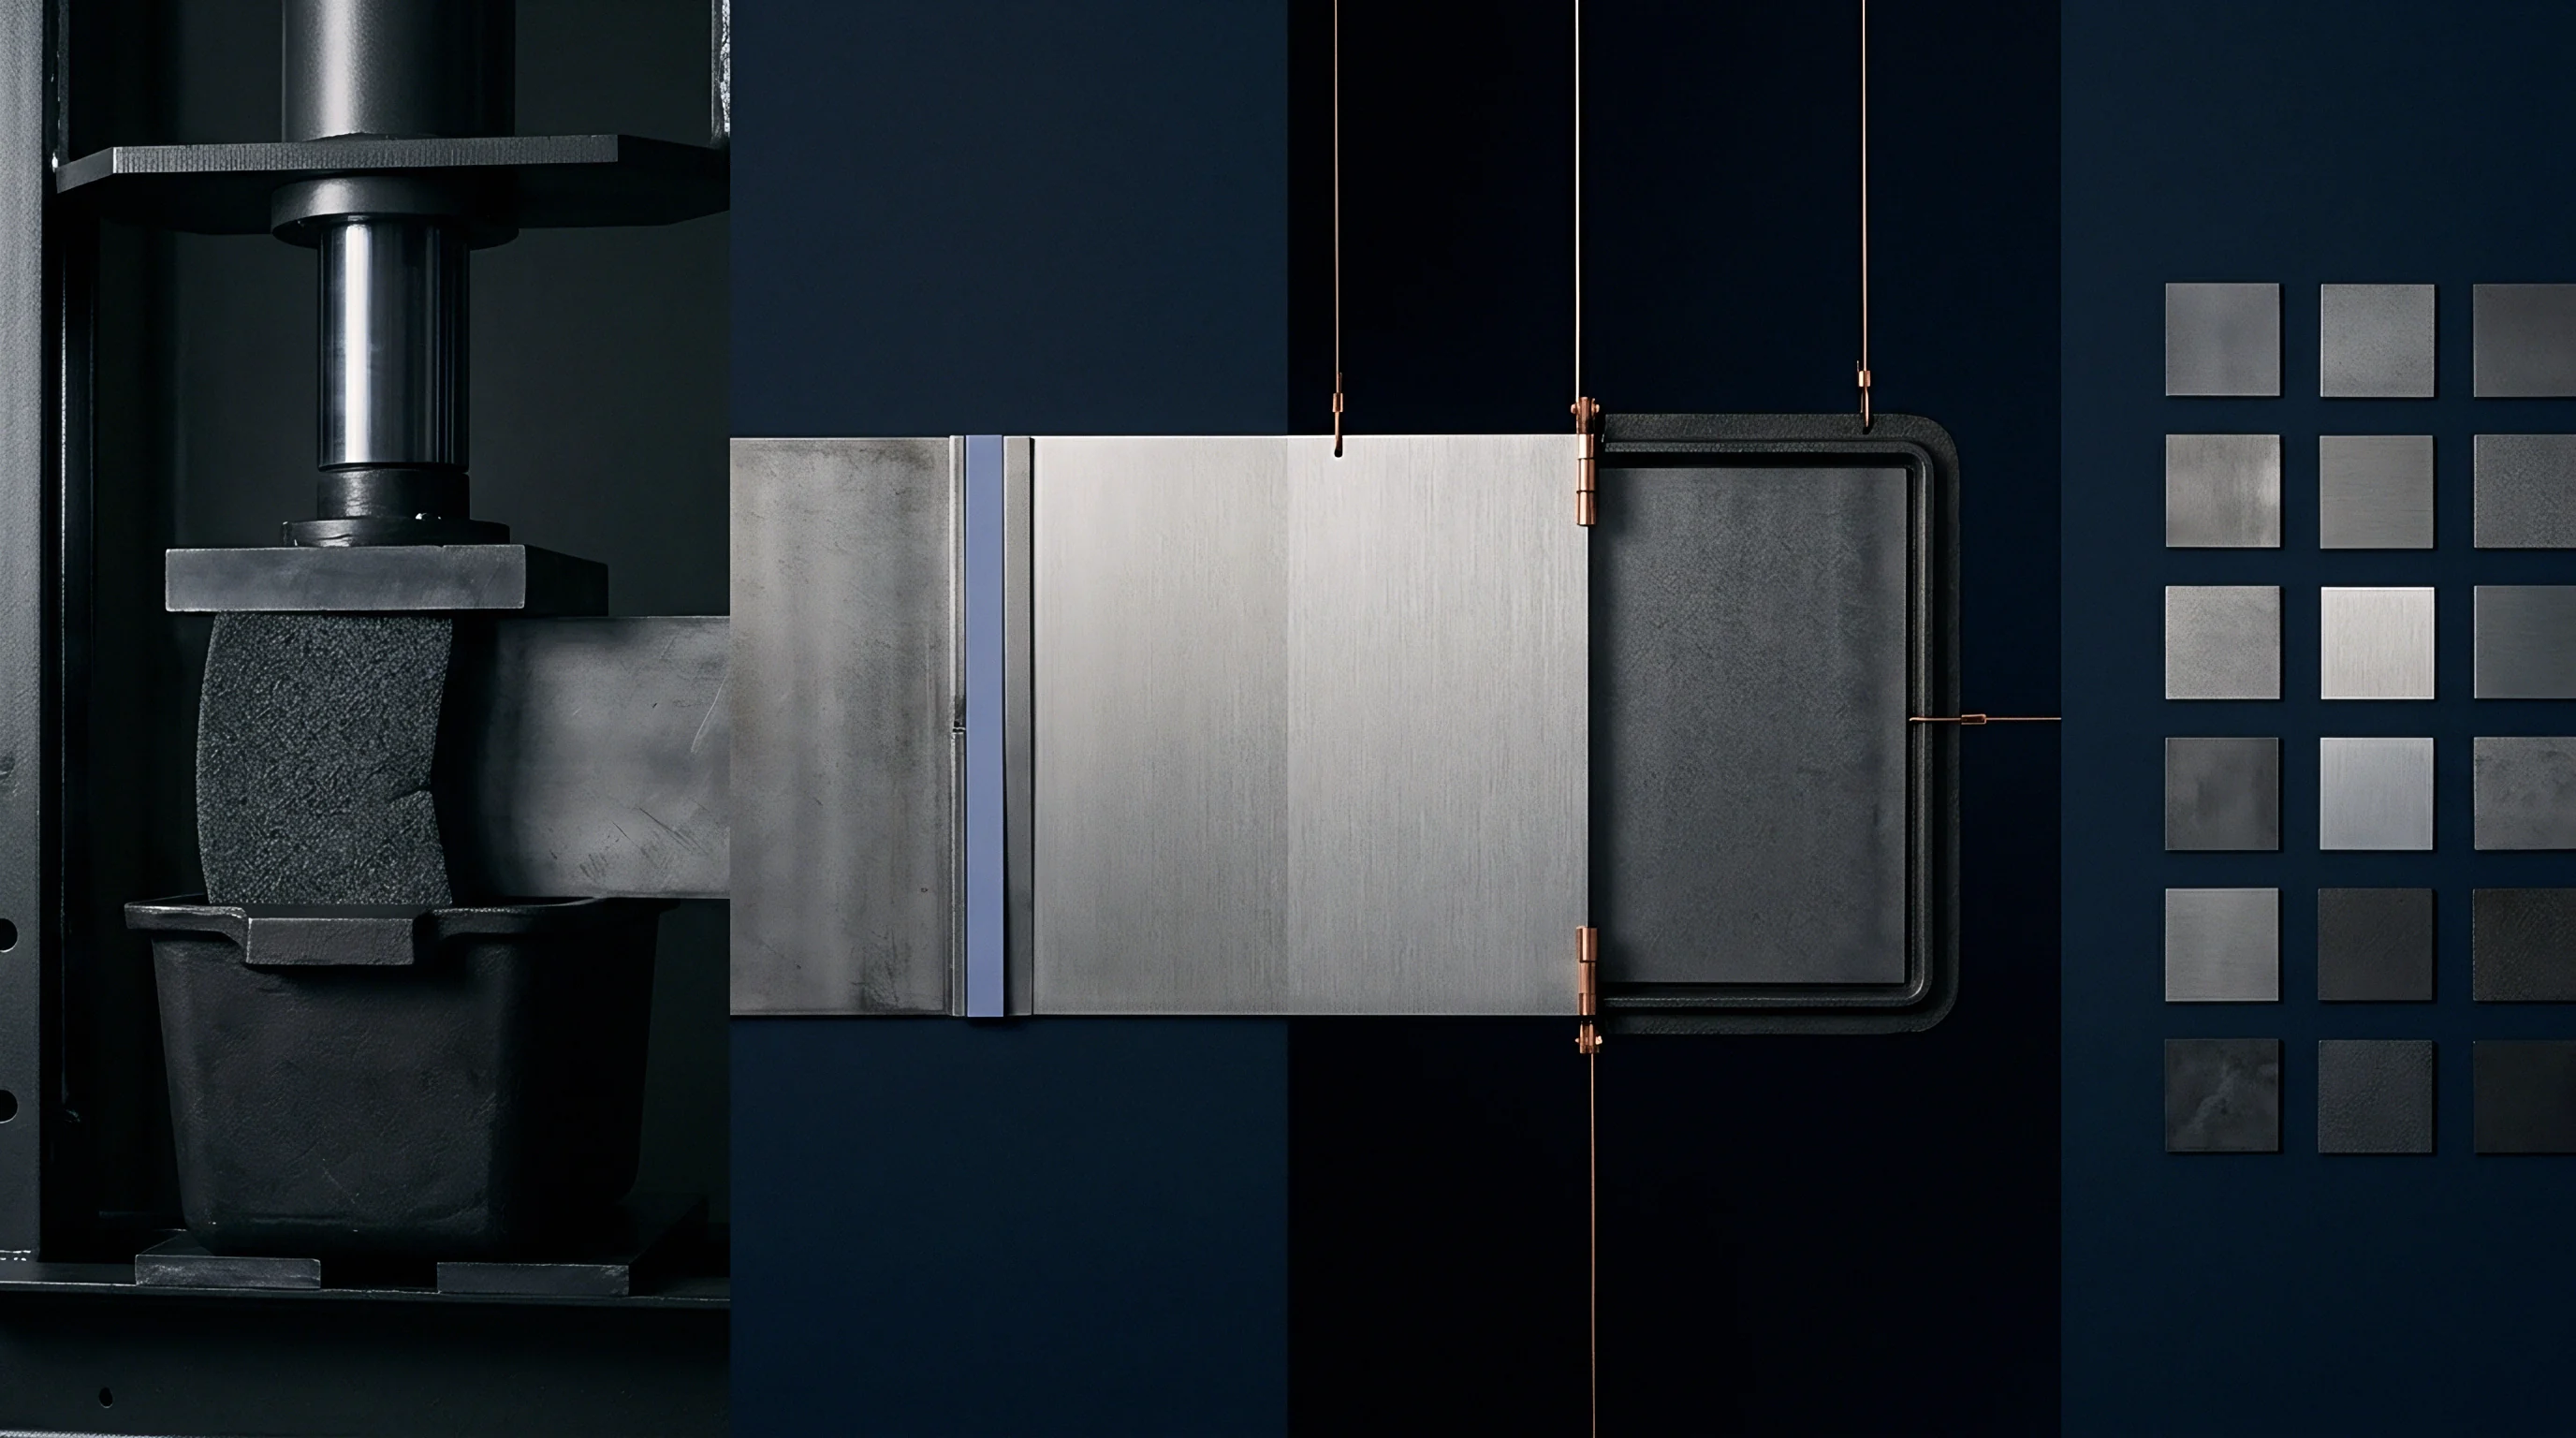
Chambers dedicated to temperature cycling introduce significant operational drag into manufacturing facilities. Liquid nitrogen injection or mechanical cascading refrigeration units demand substantial capital expenditure and continuous floor maintenance. Devices must sit inside temperature-controlled soak zones while multi-channel frequency counters collect transmission spectra at five-degree increments.
Equipment calibration cycles for sub-zero chambers require frequent downtime to clear frost accumulation and recheck thermal sensor alignment.
Wafer-level characterization at room temperature replaces ambient-to-cryogenic thermal cycling with ultra-fast vector sweeps lasting under two hundred milliseconds. High-density probe cards engage hundreds of die per substrate, collecting full admittance signatures before packaging operations take place. Defective units showing structural strain anomalies or incorrect electromechanical coupling factors receive immediate rejection before absorbing high-cost ceramic packaging materials and assembly labor hours.
| Evaluation Metric | Sub-Zero Thermal Ramp Screening | 25°C Predictive Parameter Matrix |
|---|---|---|
| Unit Test Time | 1,800 seconds per device | 0.8 seconds per device |
| Test Energy Consumption | 4.2 kilowatt-hours per hundred units | 0.003 kilowatt-hours per hundred units |
| Wafer-Level Test Capability | Incompatible with standard probe cards | Fully supported via automated probers |
| Yield Loss from Thermal Stress | 0.45 percent batch damage rate | Zero physical thermal handling damage |
| Frequency Prediction Accuracy | Direct measurement (±0.05 ppm) | Analytical regression (±0.12 ppm) |
Yield drops quickly when physical chambers introduce thermal gradients across test sockets. Temperature lag between the internal sensor and the package lid creates false test failures, forcing manufacturers to re-test entire product batches. Eliminating the thermal chamber step resolves test socket wear and prevents condensation-induced short circuits on high-impedance RF paths.
High-volume manufacturing plants running room-temperature predictive characterization achieve higher unit throughput per square meter of factory floor space.
An operator testing quartz or MEMS timing units at room temperature verifies acoustic modal purity through high-resolution frequency response sweeps around the primary resonance band.

Elasticity

Temperature Coefficients and Stress Coupling
Mathematical prediction of low-temperature frequency shifts relies on governing equations of elastic wave propagation in anisotropic media. The fundamental resonant frequency depends directly on the effective elastic stiffness tensor components and substrate geometry. Temperature changes modify these stiffness values according to first, second, and third-order temperature coefficients of elastic constants.
When a device drops to negative forty degrees Celsius, thermal contraction generates internal mechanical stress that modifies acoustic wave velocity through piezoballistic coupling.
- Continuous vector network analyzer sweeps capture the primary motional resonance frequency and anti-resonance frequency at twenty-five degrees Celsius under calibrated zero-bias conditions.
- The testing system applies stepped direct-current bias voltages to the transducer electrodes, inducing controlled internal strain fields through the converse piezoelectric effect.
- High-resolution frequency counters record the precise fractional frequency shift induced by the applied bias steps to establish the ambient strain-frequency coupling vector.
- A regression model maps the measured ambient strain sensitivity against documented material compliance matrices to compute first and second-order temperature coefficients of frequency.
Stress shifts the frequency. High-resolution measurements of drive-level dependence at ambient room temperature disclose anharmonic force constants within the acoustic cavity. When drive power increases, nonlinear acoustic loss manifests as a power-dependent shift in resonance frequency and motional resistance.
That nonlinear signature correlates strongly with second-order temperature coefficients, allowing direct computation of sub-zero frequency trajectories without lowering ambient room temperature.

Motional Parameters and Acoustic Loss Vectors
Equivalent circuit modeling translates physical acoustic mechanics into discrete electrical parameters. The motional resistance reflects total acoustic energy dissipation, encompassing anchor loss, thermoelastic damping, and grain boundary scattering. Motional inductance measures effective mass density, while motional capacitance reflects piezoelectric compliance.
At room temperature, high-precision vector fitting separates intrinsic material loss from extrinsic mounting stress.
Microstructural defects within the piezoelectric lattice increase scatter at high drive levels. These defect sites alter the local thermal expansion coefficient, distorting the parabolic frequency-temperature curve at sub-zero extremes. Room temperature harmonic analysis measures third-order intermodulation distortion products produced by these lattice defects.
The amplitude of these distortion signals provides a quantitative marker for low-temperature frequency instability.
Model errors compound. Ignoring nonlinear motional resistance variations under varying drive levels causes room-temperature predictive algorithms to underestimate negative-forty-degree frequency drift by up to three parts per million, resulting in field failures within cellular base station clock modules.


Extraction
Drive Level Dependence and Nonlinearity Mapping
Characterizing non-linear behavioral signatures requires sweeping input power across four orders of magnitude at twenty-five degrees Celsius. Automated instrumentation increments source power from minus forty decibels relative to one milliwatt up to zero decibels milliwatt while measuring transmission response curves. As acoustic energy density scales within the resonant cavity, non-linear Duffing stiffness shifts the center frequency.
The slope of this frequency shift reveals acoustic strain coefficients that govern sub-zero thermal response.
Wafer probers fitted with temperature-stabilized chucks execute high-speed S-parameter sweeps in under fifty milliseconds per die. Modern automated test systems use real-time fitting routines to calculate the modified Butterworth-Van Dyke parameters at each power level. The resulting matrix exposes fine gradients in mechanical quality factor, static capacitance, and motional resistance that signal physical material defects.
Sub-zero temperature ramp requirements shall be waived for production lots where room-temperature electromechanical predictive matrix parameters remain within six standard deviations of nominal baseline calibration vectors.
A worked example demonstrates parameter extraction for a batch of two-gigahertz scandium-doped aluminum nitride film bulk acoustic resonators. Take a wafer lot of ten thousand die evaluated on an automated probe station at twenty-five degrees Celsius. Assume baseline target values for motional resistance at fifteen ohms, quality factor at two thousand two hundred, static capacitance at 1.2 picofarads, and motional capacitance at three femtofarads.
Measuring the drive-level dependence across power steps from minus thirty to minus five decibels milliwatt yields a frequency shift rate of negative 0.15 parts per million per milliwatt. Plugging these ambient observables into a trained polynomial regression model yields predicted frequency deviations of negative 18.4 parts per million at negative forty degrees Celsius. Physical chamber verification of a fifty-unit sample from the same lot confirms actual low-temperature deviation of negative 18.2 parts per million, proving predictive accuracy within 0.2 parts per million.
Ramp speed creates gradients. Rapid sub-zero chamber ramping induces false mechanical stress through thermal shock, distorting true device parameters and causing unnecessary yield loss during standard acceptance sweeps.
Multi-Bias Wafer Probe Routines
Combining drive-level sweeps with direct-current substrate biasing enhances model prediction accuracy. Applying small voltage steps across the piezoelectric active area induces static strain, shifting the acoustic velocity according to piezoresistive and electrostrictive tensors. The resulting frequency-voltage response at room temperature directly tracks the elastic stiffness variation observed during thermal contraction.
Integrated automated probers step across eight-inch wafers without human intervention, collecting millions of data points per hour. Data acquisition systems compress raw S-parameter arrays into compact state-space representations. Advanced vector algorithms compare extracted parameters against calibrated baseline datasets to isolate sub-zero frequency outliers instantly.
Suppliers frequently contend that room-temperature parameter extraction cannot capture localized packaging stress induced by epoxy cure shrinkage during final assembly. High-resolution ambient drive-level testing combined with post-packaging harmonic analysis isolates packaging-induced mechanical strain without subjecting the package to sub-zero thermal cycling.
Metrology
Does Room Temperature Vector Fitting Predict Low Temperature Shift?
Vector impedance fitting translates complex reflection coefficients into precise mathematical models. Vector network analyzers capture amplitude and phase across a frequency span centered on the primary resonance mode. Mathematical algorithms perform multi-pole rational function approximations to separate motional response from parasitic substrate paths.
High signal-to-noise ratios are necessary to detect micro-frequency shifts that signal low-temperature frequency drift.
Data proves the fit. Rational vector fitting models achieve correlation coefficients exceeding 0.998 between calculated twenty-five degree strain sensitivity indices and measured negative-forty degree frequency shifts. The technique relies on identifying subtle frequency-dependent admittance asymmetry caused by cross-coupling between the fundamental thickness-extensional mode and unwanted spurious shear modes.
Spurious mode strength increases at low temperatures due to shifts in shear modulus. Detecting these modes at room temperature allows early rejection of unstable units.
| Extracted Parameter (25°C) | Measurement Precision Target | Sensitivity to -40°C Shift (ppm/% change) | Model Confidence Interval |
|---|---|---|---|
| Drive Level Shift Slope (dF/dP) | ±0.01 ppm/mW | 0.82 ppm shift per percent change | 99.4 percent confidence |
| Quality Factor Non-Linearity (dQ/dP) | ±50 units at 0 dBm | 0.45 ppm shift per percent change | 98.7 percent confidence |
| Harmonic Distortion Ratio (HD3) | ±0.5 dBc | 1.15 ppm shift per percent change | 99.8 percent confidence |
| DC Bias Frequency Slope (dF/dV) | ±0.02 ppm/V | 0.68 ppm shift per percent change | 99.1 percent confidence |
Probe time remains cheap. Spending fifty milliseconds acquiring high-resolution phase spectra at room temperature saves hundreds of hours of thermal chamber operational time while generating comprehensive quality assurance records for every processed wafer.

Boundary Conditions for Sub-Zero Model Validity
Predictive modeling requires defined boundary parameters to prevent misclassification. Extreme structural defects, such as film delamination or severe package micro-cracks, introduce anomalous thermal dissipation modes that bypass standard linear elasticity models. Identifying these structural failures requires multi-parameter outlier filtering routines that check room-temperature metrics against hard boundary limits.
- Uncompensated Film Stress indicates localized film delamination or excessive grain boundary oxidation when motional resistance exceeds baseline thresholds by twenty percent.
- Acoustic Mode Contamination manifests as anomalous phase ripples within the parallel resonance band, signaling high risk of sub-zero frequency hysteresis.
- Parasitic Capacitance Drift reveals packaging dielectric contamination or moisture ingress when static-to-motional capacitance ratios deviate beyond specified control bounds.
- Drive Level Instability exposes severe crystal lattice dislocation networks that generate unpredictable frequency jumps under sub-zero thermal contraction.
- Nonlinear Insertion Loss Variations identify micro-crack propagation within mounting pedestals, leading to premature mechanical failure during environmental thermal shock.
Standard aerospace procurement specifications mandate that predictive mathematical modeling techniques undergo baseline validation against a physical fifty-unit thermal ramp sample for every new wafer fab lot. This dual-verification protocol ensures that subtle process modifications do not compromise sub-zero prediction accuracy.

Variance
Statistical Outlier Rejection Thresholds
Process variations between manufacturing lots alter baseline physical constants, requiring adaptive statistical screening. Statistical process control systems monitor room-temperature predictive parameter distributions in real time. Multivariate Mahalanobis distance metrics combine quality factor, motional resistance, drive-level slope, and static capacitance into a single unified health score for each test unit.
Units falling outside defined confidence ellipsoids face automatic rejection, regardless of whether their individual single-point values pass standard limits.
Wafer yield governs margin. Identifying abnormal statistical dispersion early prevents shipping devices that meet room-temperature frequency limits but exhibit severe sub-zero frequency drift in customer applications.
A statistical process window bounded by six-sigma Mahalanobis distance limits guarantees sub-zero frequency compliance without physical temperature chamber testing.
Automated test systems calculate running covariance matrices across ten consecutive production wafers. When process drift moves matrix centroids beyond pre-set control limits, the automated system flags the manufacturing line for recalibration. This real-time visibility prevents latent material defects from propagating through packaging and final test operations.

Process Drift and Recalibration Trajectories
Changes in sputtering target age, chemical vapor deposition gas ratios, or photolithography focus shift ambient electromechanical properties over time. Maintaining high prediction confidence requires periodic recalibration of the room-temperature transformation matrix. Recalibration involves running a small, statistically selected sample of devices through a full physical sub-zero thermal ramp sweep to update model polynomial coefficients.
- Extract baseline parameters across five hundred sample die at twenty-five degrees Celsius using automated wafer probers.
- Execute sub-zero thermal ramps on a twenty-unit calibration sample to collect actual frequency shifts at negative forty degrees Celsius.
- Perform multivariate regression analysis to update polynomial coefficients within the room-temperature predictive transformation algorithm.
- Validate updated predictive models against an independent test lot to verify sub-zero frequency prediction accuracy within specified limits.
How far can piezoelectric layer stoichiometry drift before room temperature vector models lose prediction accuracy at negative forty degrees Celsius? That question remains central to setting recalibration frequency limits in high-volume production lines.


Economics
Capital Spend and Test Bay Throughput
Transitioning from physical thermal chamber screening to predictive room-temperature testing restructures the cost framework of high-reliability frequency control manufacturing. A single sub-zero thermal ramp test bay housing automated thermal chambers and multi-channel frequency counters requires an initial capital expenditure exceeding four hundred thousand dollars. Operating costs include continuous liquid nitrogen supply, electrical power consumption, socket replacement, and regular thermal calibration services.
Throughput bottlenecks force high-volume manufacturers to duplicate these capital-intensive test bays to match fab production rates.
Chambers leak heat. Replacing thermal chambers with automated wafer-level probe stations cuts electrical energy consumption by over ninety-nine percent per tested device. Standard probe stations complete complete vector parameter sweeps in under one second, multiplying daily unit throughput by two orders of magnitude compared to batch chamber sweeps.
The reduced floor space footprint allows manufacturing facilities to expand productive cleanroom capacity without expanding physical building boundaries.
Elimination of thermal ramp testing reduces test-related operating expenses by eighty-four percent while increasing weekly unit shipments twelve-fold.
Consider a high-volume facility producing five million high-reliability timing resonators annually. Capital equipment requirements for physical sub-zero thermal screening demand twenty-four thermal test bays operating continuously. Transitioning to predictive room-temperature characterization reduces equipment requirements to two high-speed automated wafer probe stations.
Total capital equipment expenditure drops from 9.6 million dollars to 1.2 million dollars, releasing 8.4 million dollars in capital for core semiconductor processing infrastructure. Direct operational cost savings from reduced power consumption, liquid nitrogen elimination, and lower labor overhead total 1.8 million dollars per year.

Payback Dynamics across Production Batches
Financial payback calculations show rapid amortisation of predictive test software and methodology development expenses. Initial investment in high-resolution vector network analyzer hardware, multi-bias probe cards, and statistical modeling software yields full cost recovery within four months of full production deployment. Yield improvements driven by wafer-level rejection of defective units before high-cost ceramic packaging add directly to gross margin performance.
Test throughput scales. By converting test operations into an ultra-fast room-temperature software routine, manufacturing lines absorb unexpected production volume spikes without buying extra thermal chambers or leasing secondary test facilities. Elimination of thermal shock damage during testing lowers warranty return rates, protecting long-term contract pricing and brand equity in high-reliability aerospace, telecommunications, and defense markets.
Noise limits precision. High-resolution instrumentation at twenty-five degrees Celsius provides the stable, reproducible physical measurements needed to defend sub-zero performance claims before demanding enterprise customers and military procurement boards.